It’s time for some fresh number-crunching using Club Log! Without relying on anything but broad, aggregate data there is so much that we can reveal, all from our ADIF files combined in one large database. This is one of the great advantages of the “big data” resource you’ve created by uploading your logs to Club Log, and I’m very grateful for your participation. It means, for example, I can compute the Most Wanted list by ranking activity (per band, mode or continent – or any combination of the three) or understand new trends in operating habits and report back to you. That’s just what I’ll do here.
As we enter 2019, I’ve been running some reports on activity uploaded in logs up to the end of December last year.
The average number of QSOs made by each Club Log user who uploaded a log during 2018 was 1,900 QSOs. You could characterise Club Log users as quite active radio amateurs, I think!
The total number of QSOs uploaded was quite high – more than any previous year – at 41.3 million QSOs. That’s 12% higher than 2017 or 2016 (which were nearly identical at 36.8 million QSO each – and 2015 was 39.8 million). I think that fact is more significant given the ongoing decline of this particular solar cycle, and it’s possible evidence of extra activity from FT8 and newly-active amateurs who’d run out of steam on CW and SSB, but are back to try digital modes.
Operating Habits
In 2017, 8,000 Club Log users had uploaded at least one QSO with FT8. However, in 2018, that number has risen to 14,200. For comparison, 13,900 users uploaded at least one CW contact, and 18,000 at least one phone (mainly SSB) contact. The total number of active users was just under 22,000 across all modes in 2018. What may surprise you is that this is down from 24,500 in 2015 (it’s fallen a little bit each year since then). I hate to mention our demographic. Let’s assume people are bored of Club Log, which is an easier pill to swallow!
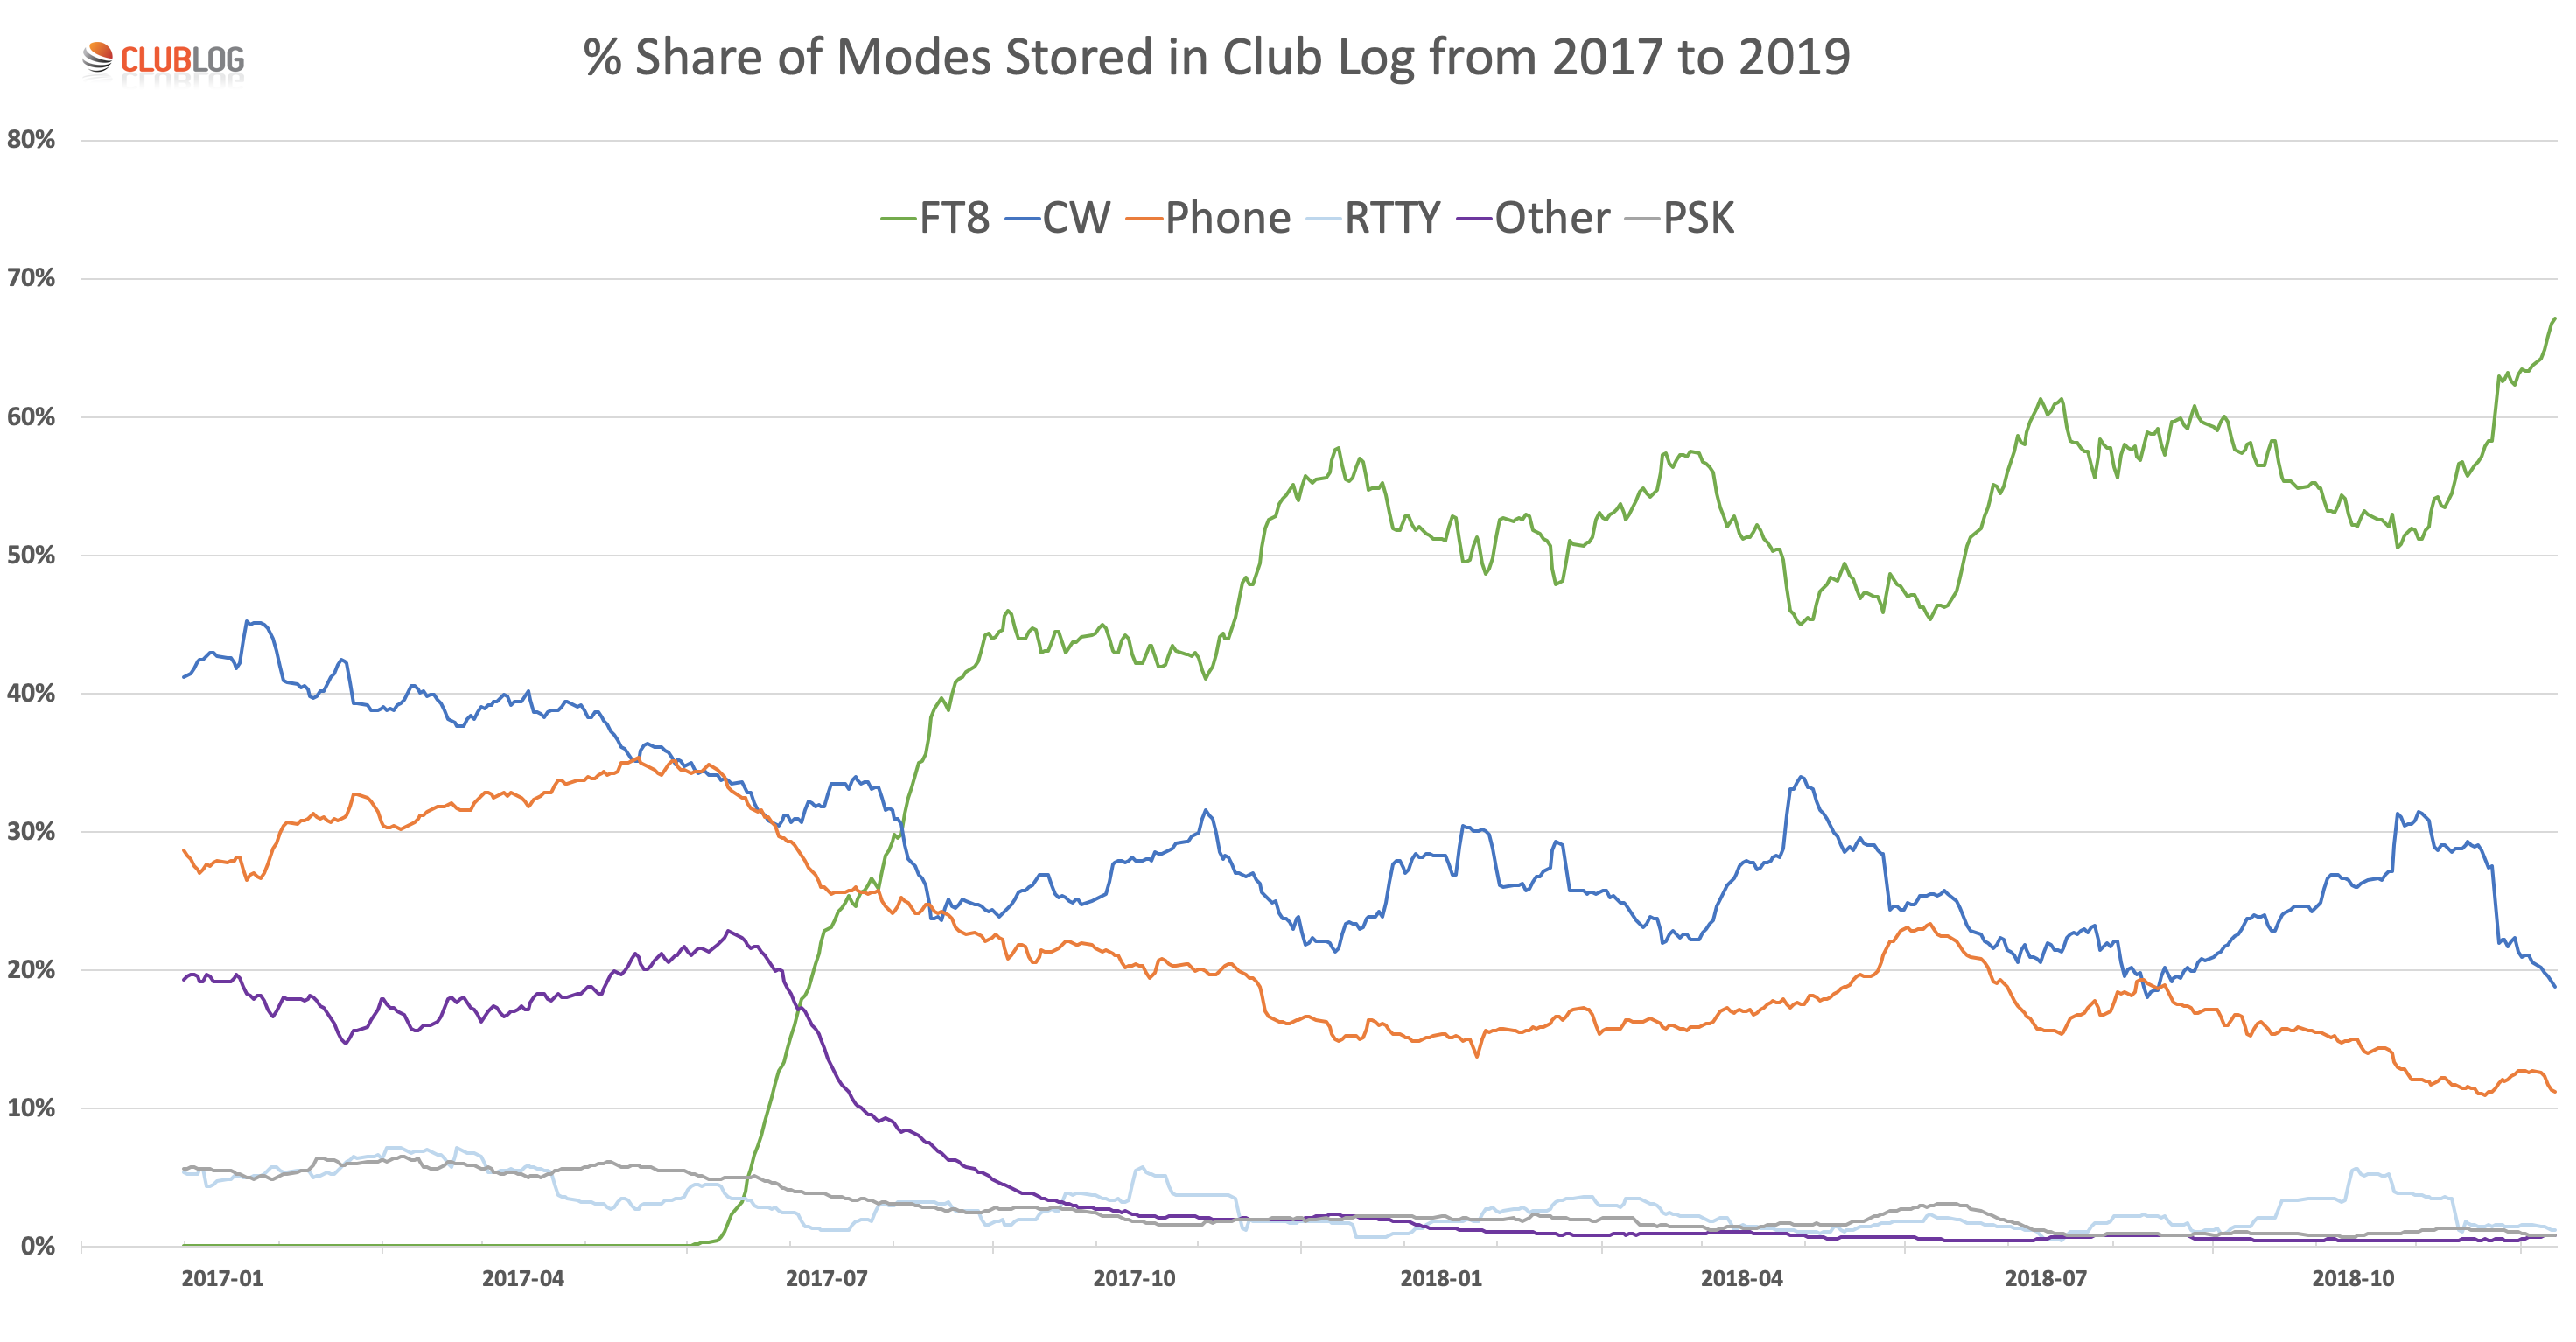
To download the original graph, use: https://g7vjr.org/wp-content/uploads/2019/03/clublog-modes-2017-2018.png
When we look at the graph of QSOs, you can deduce that FT8 users must be prolific in terms of the number of QSOs they make when they’re on the air. Perhaps this reflects the fact that it is possible to do other tasks in the shack, or even – however controversial – to automate FT8 to some extent, as well as noticing marginal openings, seeing every single CQ on the band, and working QSOs in all conditions. Once you start making FT8 QSOs, I get the feeling it’s more likely you’ll be on the bands for longer in a session as it can be quite addictive working DX in the noise. Having those absolute signal-to-noise figures is compelling.
One other number I can report is that around 270 DXCCs have been active on FT8 in 2018. For a list of the entities and some other comments, please have a look at the Club Log reflector: https://groups.google.com/forum/?fromgroups#!topic/clublog/iG3lnCQVDz. It’s quite a showing for FT8, even allowing for a few popular busted calls or pirates reducing the total a little. Even if the total is 260, that’s getting close to the number of active entities computed by Joe, W1JR in his Year End Review (which was 287 – a number that Club Log corroborates).
Expeditions
There were 97 logs that used Club Log’s expedition mode (charts, leaderboards, etc.) between 2018-01-01 and the date I produced this report in early 2019. Of those expeditions, 64 (about two-thirds of them) used FT8 while they were active on the bands.
In total, those expeditions made 150,000 FT8 QSOs, so each made an average of 2,200 QSOs. This compares to their total number of QSOs of 2.33 million (an average of 24,000 QSOs by each expedition). By the way, that means 5.6% of all the QSOs in the year were made by just 97 expedition callsigns.
In terms of FT8, 6.4% of Club Log expedition QSOs were FT8 last year; maybe lower than I expected. For more detailed and granular information, head to https://clublog.org/expeditions.php.
I have a few thoughts on this. On the one hand, it’s quite likely that more modest stations are making contacts with rare DXCCs (especially since in expedition mode, FT8 favours weaker signals first – a good piece of social engineering if ever there was one!). Surely that is good news.
But, while FT8 achieves excellent weak signal performance, it does come at the expense of speed. With many expeditions to rarer locations being somewhat constrained logistically, and not having the luxury of staying a long time, operating FT8 could be seen as something of a trade-off – although the arguments are certainly very nuanced. Even so, for pure throughput it seems expeditions are still getting the numbers from other modes. Expeditioners like to work pileups and amass as many contacts as they can, after all.
I wonder where this will lead in the coming years? More automation and more parallelism by expeditions using FT8 seems quite likely to me, perhaps allowing operators to work SSB and CW at the same time as the computer works FT8.
The future of FT8 and DXing
If all this causes a bit of soul-searching among the true blue DXers, perhaps it should. I know it has been debated almost constantly over the past 18 months.
Do DXers approve of a scientist on a remote Antarctic island with a commercial broadband HF antenna (VK0/m perhaps) using FT8? For them – and for us as DXers wanting a new one – it’s a viable way for a professional with little expedition experience to be productive and active on the radio, perhaps while also working on their day job. More importantly, that precious human being on a rare location is not being chased off the bands by aggressive DXers on SSB, as we have seen many times in the past. That’s at least one scenario where I can see no reason to complain.
Taking another example, for some FT8 might be the only way to stay in the hobby, and maybe get Worked All Continents from a very limited plot with stringent local planning regulations preventing more ambitious sideband or CW DXing. Their achievement, like all DXing, is going to be relative to their means. It’s all about the context.
However, I think we mustn’t romanticise those particular situations too much. A lot of the FT8 on the bands today is just plain old competitive. It’s generally become a QRO mode, and it’s fierce in its ways. SSB and CW CQ’s are often going unanswered, while a tiny sliver of each band heaves with FT8. This pattern hasn’t relented in 2018. That’s not great news.
Perhaps reaching the honour roll on DXCC Phone or DXCC CW now has a higher premium on it, as achieving it requires more personal time, more searching and a lot more concentration – and probably a more capable station, on average – than FT8. This is all built into our perceptions of the prestige and worth of the DXCC awards and whether we’re willing to invest our efforts in their pursuit!
Notes on statistics and measurements
Each time I’ve reported on FT8, these points have come up, so I want to make sure I draw your attention to them up front.
- Contests have been manually chopped out of the data set
In the past, contests which favour one mode (for example, CQWW SSB or WPX CW) have introduced spikes in the data, which although they can be smoothed, tend to disturb the data set and need extra explanation. Since they are easy to spot, I’ve removed them from the data this year, essentially smoothing over them as if they were normal days on the bands. I may have missed a few smaller ones. I’ve used a 30-day moving average, and since contests don’t last more than 48-hours I feel this is reasonable. It is all about trends, not absolutes, but I still think you should know I’ve done this smoothing and sampling.
- Selection bias (digital mode users are all computerised, Club Log users are all computerised)
Since my report relies on the Club Log database, it has a selection bias. As I mentioned, around 22,000 users uploaded at least one QSO in 2018. This is certainly less than the total number of callsigns that have been seen on the bands. I have tried to measure the total population of radio amateurs several times over the years, but it is quite hard (I often stop when I realise how many special contest calls, suffixes and indeed busted calls get logged). I’m sure it’s more than 22,000, perhaps being closer to 60,000. There are some posts on my blog at g7vjr.org about this.
That means there are plenty of people whose activity isn’t being included here. Perhaps they prefer not to use Club Log or haven’t computerised. I would obviously encourage you to keep promoting Club Log to anyone you can (or sign up if you haven’t) but the bias will remain. To compound matters, FT8 users aremuchmore likely to be using Club Log since they are already engaged in computers as part of their activity in amateur radio.
The long and short of it is that this means there is a bias towards FT8 in my report. You’ll need to decide for yourself if you think this is a big problem or not; I’m fairly ok with it, as I feel Club Log is adopted most heavily by the more active radio amateur. Perhaps analysing the DX cluster or Skimmer spots could help here, anyone?
- Relative, not absolute levels of activity
I’ve expressed the graph of modes in relative terms. The percentages in the graph are the percentages of the modes on the air from day to day, with a moving average of 30 days to smooth the movements into a trend line. It happens that this method produces good graphs, which make the trends easy to interpret.
Another approach I could have used would be to plot absolutes – the number of QSOs on each mode, not their relative proportions. I’ve certainly tried this, but unfortunately, that doesn’t produce a graph you can read. It is very “spikey”, and the trend is far harder to see.
I’ve studied the data in a lot of tools, because I’ve been asked if FT8 is cannibalising other modes or just increasing overall activity. I do believe that FT8 has taken activity from other modes in absolute terms. This is what I see in the data and what I hear on the bands. But, please don’t take my word for it – the raw data is available at https://g7vjr.org/2018/05/raw-data-for-analysing-the-modes-of-qsos-uploaded-to-club-log/. If anyone reading this wants to try their hand at making a good visualisation of the absolute data, it would be great to see it and I’d be delighted to publish it alongside this year’s graph. The raw data is updated automatically every month.
Footnote from Yutaka, JQ2GYU:
I have made only five QSOs by FT8 so far. (KH1 x 2 bands, VP6/D, VK0/M, and HP). I prefer CW for the purpose of “DXing”, and SSB for rag-chewing with foreign hams in the English language.
I believe there is another “Value Proposition” in ham radio, besides just QSOing. It is a place to try and experience some prototype technologies which might be innovations that change our future lives.
(1) FM handheld transceivers and repeaters was one of them, when we didn’t have any cellular or mobile phones.
(2) AX.25 packet radio with a laptop PC was one of them, when we didn’t have any tablet or smart phones.
(3) TCP/IP over AX.25 packet radio was one of them, when we didn’t have widespread internet access for the general population.We experienced the future and saw technological progress evolving.
We can use FT8 or similar types of modes which have strong coding robustness, for a kind of Internet Of Things (IoT) communication. A small transceiver on HF with FT8 may gather field data to upload to a cloud service for analysis, for example. Ham radio is not only for QSOs, but experimentation should be also fun.
Yutaka, JQ2GYU/JF1LZQ