A question that comes up in the context of DXpeditions is just how many uniques are there out there? We’re aware that there are at least 50,000 (a record set by T32C in 2011) but can we estimate the full size of the population?
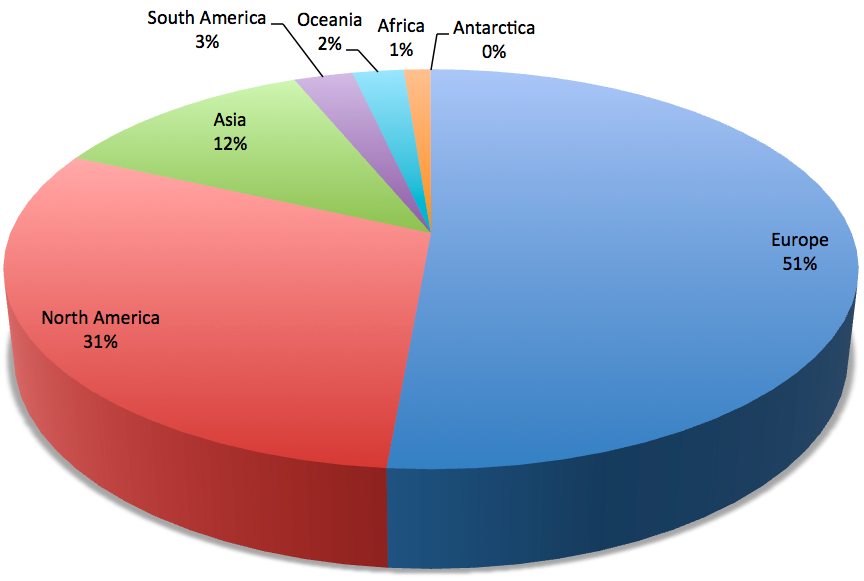
I ran a short database analysis against Club Log’s records for QSOs made after 1 January 2012. How many unique callsigns are worked in each continent?
Update: The answer is pretty interesting. Based on feedback from when I first posted this table, I’ve extended it to show the number of uniques declines when you require more than 1 logged QSO, and even more when over 5 logged QSOs are needed to consider a callsign valid.
| Continent | 1+ logged QSOs | 2+ logged QSOs | 6+ logged QSOs |
|---|---|---|---|
| Europe | 269,000 | 132,000 | 77,500 |
| North America | 157,000 | 82,000 | 46,000 |
| Asia | 73,000 | 33,000 | 18,000 |
| South America | 17,300 | 7,800 | 4,000 |
| Oceania | 13,400 | 6,400 | 3,500 |
| Africa | 7,800 | 3,400 | 1,800 |
| Antarctica | 151* | 63 | 37 |
The sample size is 24 million QSOs. Counting just unique callsigns appears to me to strongly emphasize problem QSOs. That’s a trend which should be expected to get worse with a bigger sample, since that would mean there will be more unique errors in the data. For example, if the size of the sample doubled to 48 million QSOs then the 1+ QSOs column would inflate a lot, and the others would increase too. It’s probably best to focus on the 6+ column, above. That means that likely over 50 people have the call in their log worldwide; small enough to catch very short operations but large enough to avoid one-off mistakes.
The countries are grouped by continent as per normal ARRL conventions (followed strictly by Club Log). Allow for special events, contest calls, temporary callsigns, as well as logging errors. It’s striking that individual logging errors must be a substantial source of uniques in the average log. Is there another explanation for the difference between 151 and 37 Antarctic stations when we require not one, but 6+ references to the call? In the context of 24 million QSOs, noise is significant. I suppose that some callsigns will get busted more than others, too – and the more prefixes there are in a continent, perhaps the more error-prone that continent becomes?
Here are the top 30 DXCC entities by population (using the 6+ QSOs filter and again working from 1 January 2012 to the present day, April 2013):
| USA | 40809 |
| JAPAN | 11340 |
| FEDERAL REPUBLIC OF GERMANY | 11010 |
| EUROPEAN RUSSIA | 8216 |
| ITALY | 8074 |
| ENGLAND (many special calls in use in 2012) | 7750 |
| SPAIN | 4822 |
| UKRAINE | 4665 |
| FRANCE | 4029 |
| POLAND | 3903 |
| CANADA | 2974 |
| ASIATIC RUSSIA | 2628 |
| NETHERLANDS | 2354 |
| CZECH REPUBLIC | 1897 |
| SWEDEN | 1798 |
| BRAZIL | 1682 |
| BELGIUM | 1605 |
| AUSTRALIA | 1545 |
| ROMANIA | 1235 |
| FINLAND | 1228 |
| AUSTRIA | 1157 |
| SWITZERLAND | 1034 |
| HUNGARY | 1013 |
| ARGENTINA | 945 |
| SCOTLAND (many special calls in use in 2012) | 887 |
| CHINA | 854 |
| DENMARK | 842 |
| NORWAY | 808 |
| CROATIA | 801 |
| GREECE | 756 |
A further analysis which I have performed is to check whether continental populations are changing in proportion over time. Are any continents showing an increase relative to others? Since 2000, it seems probably not. Here is the data (“Unique callsigns by continent, as found in Club Log data from 2000 to 2013 where unique means a distinct callsign appearing not less than 3 times”).
| Year | AN | AS | EU | NA | OC | SA |
| 2000 | 0.0% | 13.0% | 45.7% | 34.4% | 2.5% | 3.0% |
| 2001 | 0.0% | 12.8% | 46.1% | 35.0% | 2.1% | 2.7% |
| 2002 | 0.0% | 12.6% | 46.7% | 34.5% | 2.1% | 2.9% |
| 2003 | 0.0% | 12.0% | 51.2% | 30.8% | 1.9% | 2.9% |
| 2004 | 0.0% | 12.1% | 51.4% | 30.5% | 2.0% | 2.7% |
| 2005 | 0.0% | 11.5% | 53.5% | 29.2% | 1.9% | 2.5% |
| 2006 | 0.0% | 10.8% | 54.3% | 29.2% | 2.0% | 2.3% |
| 2007 | 0.0% | 11.0% | 53.0% | 30.4% | 2.1% | 2.3% |
| 2008 | 0.0% | 11.0% | 52.9% | 30.2% | 2.2% | 2.4% |
| 2009 | 0.0% | 11.3% | 50.9% | 31.7% | 2.2% | 2.6% |
| 2010 | 0.0% | 11.8% | 50.9% | 31.0% | 2.3% | 2.8% |
| 2011 | 0.0% | 12.4% | 48.7% | 32.6% | 2.3% | 2.8% |
| 2012 | 0.0% | 12.1% | 50.7% | 30.8% | 2.3% | 2.8% |
| 2013 | 0.0% | 11.5% | 52.0% | 30.9% | 2.0% | 2.4% |
(Apologies for the absence of AF in the data above – this was unintentionally missed off by G7VJR when copying the data into HTML – I will add this data back shortly).
Great job Michael, congratulations
Almost certainly a massive exaggeration – there will be a lot of busts in there. What about those logged at least three times?
Yep, I’m doing that analysis with the hope of getting a little closer!
Ok, the updated stats are above (complete with original data for comparison). What a reduction!
Michael, that is an intriguing analysis. I’ve been chasing the question of the number of DX-interested hams for some time. I focused on the only other publicly available data source: Logbook of the World published statistics. More to the point, the LOTW site currently lists 495.2 million QSOs in their data base, with 70.4 million “matches” (each match = 2 QSOs), so the LOTW QSL rate is on average 70.4×2/495.2 or about 0.284. Since LOTW also lists 57,000 users, than the population of DX-interested hams can be estimated as about 57,000/0.284 or just over 200,000 hams world wide. See http://www.hb9bza.net/lotw-users-list to estimate how different country populations factor into that estimate. Also, by my own long therm survey, I estimate that the error rate in the LOTW totals hovers around 10%. This would knock the population down to about 180,000 hams world wide. A larger user base (HB9BZA lists 62,566 total users, and LOTW further lists 85,600 ‘certificates issued’) would increase my population estimate, so I’ll go with the nice round figure of “200,000 hams world wide have an interest in DX”. – Kai, KE4PT
Hi Michael,
If you have used Club Log to garner the information, then this means that there may well be DXers that do not use Club Log and therefore are excluded. Would the number of non Club Log users be significant?
Regards
David
Hi David,
It is not the callsigns of Club Log users that have been analysed, but everyone they’ve worked in their log (in this case, 24 million QSOs). I would feel comfortable to say that these QSOs are a good corpus from which to make general deductions about the amateur population. One reason I’m happy with this corpus is that the numbers do not change when I halve the population inside the sample.
73
Michael G7VJR
Good bit of work Michael. It is always interesting to see that in the case of the UK versus Italy for example, the numbers are pretty well the same, take the odd hundred or so, and yet, in a pile up of a rare DX station, there always seem to be far fewer UK stations active and lots more Italian stations. I think a greater depth of analysis is needed to try and work out the proportion in each country of the really ACTIVE DX stations. Maybe the amateur DX population is not the criteria, but those who are really active is what counts.
This is great analysis, but perhaps “oversells things”. It is probably a better count of actual call signs rather than actual human beings.
Moreover, LOTW is suggestive of another calculation. It’s more complicated than this, because of “entity” boundaries and non-DX participation in LOTW, but we should expect that the number of matches to be about the square root of participants. Let me explain this. If “50 per cent” of hams participated in LOTW, then we would expect to see a “25 per cent” match rate. So, if we take the square root of the match rate, we should approximate what fraction of the LOTW data base represents participating users and the rest would be non-participants. But, that would again be by call sign, not human being (albeit it many of us won’t log more than one call into these sources).
The current match rate is 14 per cent. The square root would be 37 per cent. By my rough approximation (as good as could be done without access to a lot of Newington’s data), it suggests to me that there would be 154,000 call signs if all relevant hams (some not DXers, keep in mind) participated compared to the participation rate.
Rough-and-ready as my calculation is, it comes to a very similar conclusion as the study above.
Larry Wo0Z
Major DXpeditions who use LOTW might also be able to give a good value of the world-wide ham population, though it might take some work.
If those who owned such data looked at their LOTW matches versus non-matches, they would have a more accurate version of my rough-and-ready calculation above and this, in turn, would give a good estimate of total world-wide hams. The most obvious way would be to take unique calls with at least one LOTW match versus unique calls with no LOTW matches. (I think we can assume most hams will upload the major DXpeditions even for those who might upload less than their full logs to LOTW). LOTW matches should seldom/never be busted calls and ratioing from LOTW participation should not have to worry about that.
It would be interesting to see if that work could be done for two or three of those, and whether the values cross-checked to the same overall estimated population.
In the case of DXpedition LOTW matching as I suggest here, it probably would be closer to real human beings than what is so far posted up, since relatively few of us are using a great number of alternate call signs in a particular DXpedition.
I suppose sometimes we’ll want to know it by call sign anyway, but a count of real people, as opposed to call signs, is (I think) of great interest as well.
Hi Larry,
Please see my LOTW analysis up earlier in this thread. The match rate for LOTW is indeed about 14%. But, it takes two QSO records from the 495 million QSO which contain both LOTW users and many non-users. Not accounting for errors in the uploads, you can estimate the population of “Dx active” hams as the number of LOTW users (57000) divided by the average LOTW QSL rate (about 28% — twice the match rate). That’s how I came up with 200,000 DX active hams, 57000 of whom are LOTW users. Errors in uploads would reduce the estimate.
Subject to that old saw “there are liars, damn lairs and statistician”, we might be tempted to say that there are somewhat fewer than 200,000 DXers out there.
Similar info might be gleaned from the 24 million Club Log QSOs by finding the “match rate” in the uploads (we don’t have access to this figure), counting the Club log users divided by the average “QSL rate”
73,
Kai, KE4PT
Congrats for your work , I suggest another job for you
-How many contesters are there in the world? Thanks.
Hi Kai,
The figure about the match rate is actually publicly available on Club Log – here are the numbers:
– Registered callsigns = 23,400
– QSOs uploaded = 158.1 million
– QSOs matched = 8.6 million (do not divide by 2)
73
Michael G7VJR
Hi Michael,
We need a “QSL rate” not a match rate, I think, because it takes two out of the 158.1 million to get one match, so the QSL rate is double the match rate. Two hams benefit from each match.
So the calculation would go like:
23,400 x 158.1/(2 x 8.6) = 215,000 Dxers, and again, the figure would drop if there are uploaded errors. This is close to the 200,000 I got using LOTW’s half a billion QSOs.
Cheers!
Kai KE4PT
I don’t think your calculations can presume to measure DXers, but rather I think it measures “active hams”, of which DXers is a fractional subset.
For example, my moderate sized log on ClubLog (50K QSO’s) is very heavily skewed toward contest Q’s, not DXing Q’s, and predominately toward W/K Q’s since I concentrate on domestic contests.
Similarly, my hit-rate in LoTW is perhaps 90% “W-to-W”.
Can you run your analysis counting only cross-border QSO’s?
73, de Hans, K0HB