Club Log’s most wanted list is available at any time from this URL:
https://secure.clublog.org/mostwanted.php
The data set which creates this list is derived from QSOs uploaded by users, so with the exception of a certain amount of noise from bad logging, it is a factual (certainly, empirical) result. The percentages indicated next to each entity are the percentage of the users in Club Log who need to work the entity for an all-time new one (ATNO). When you filter the report by continent, the reduced population of users is taken into consideration, but if you filter by mode this does not apply.
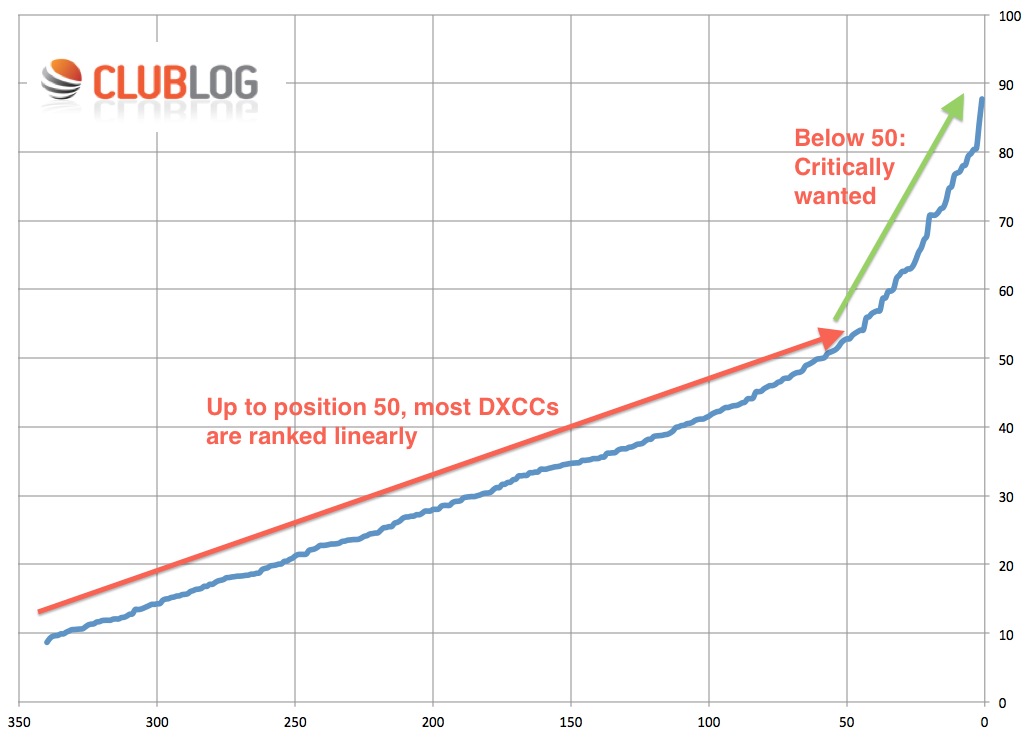
One of the interesting things you can do is plot these percentages on a graph. Personally, I would not labour too much over the exact percentage values (nor why even the lowest ranking entities haven’t been worked by 100% of users – it’s about QSL claims, mainly). The shape is interesting.
You can see, below, that the shape of the graph highlights that the entities in the top 50 are the ones which have some kind of special rarity: probably cost, difficulty of access or remoteness, permits and political restrictions.

Here are those “critically wanted” entities – these are the ones that need our support (predominantly financial) to get them on the air: