As in previous years, I’ve generated some new reports to reveal trends about how we’re using different modes on the bands. This year, I’ve generated a few extra reports to try and explore other relevant trends about activity levels (working from home, perhaps?) and the use of different bands (which correlates well with solar activity).
I haven’t done any sophisticated statistical work on the data, but I’ve used smoothing (using Excel’s trendlines with moving averages) to make the charts easier to interpret. It’s worth remembering the limitations of the data set, too: even though it is very large, and hopefully very closely represents activity found on the air, only computer logging is compatible with tools like Club Log, and do remember as well that Club Log is designed for and typically used by HF DXers rather than VHF/satellite users.
This report is only possible thanks to the data in 84,000+ Club Log logs, provided by our amazing community of users who have uploaded their ADIF files regularly. At the time of writing, Club Log has 731 million QSOs recorded, which is sufficient for trends found in the data to be robust. Thanks again, to everyone who uploaded QSOs!
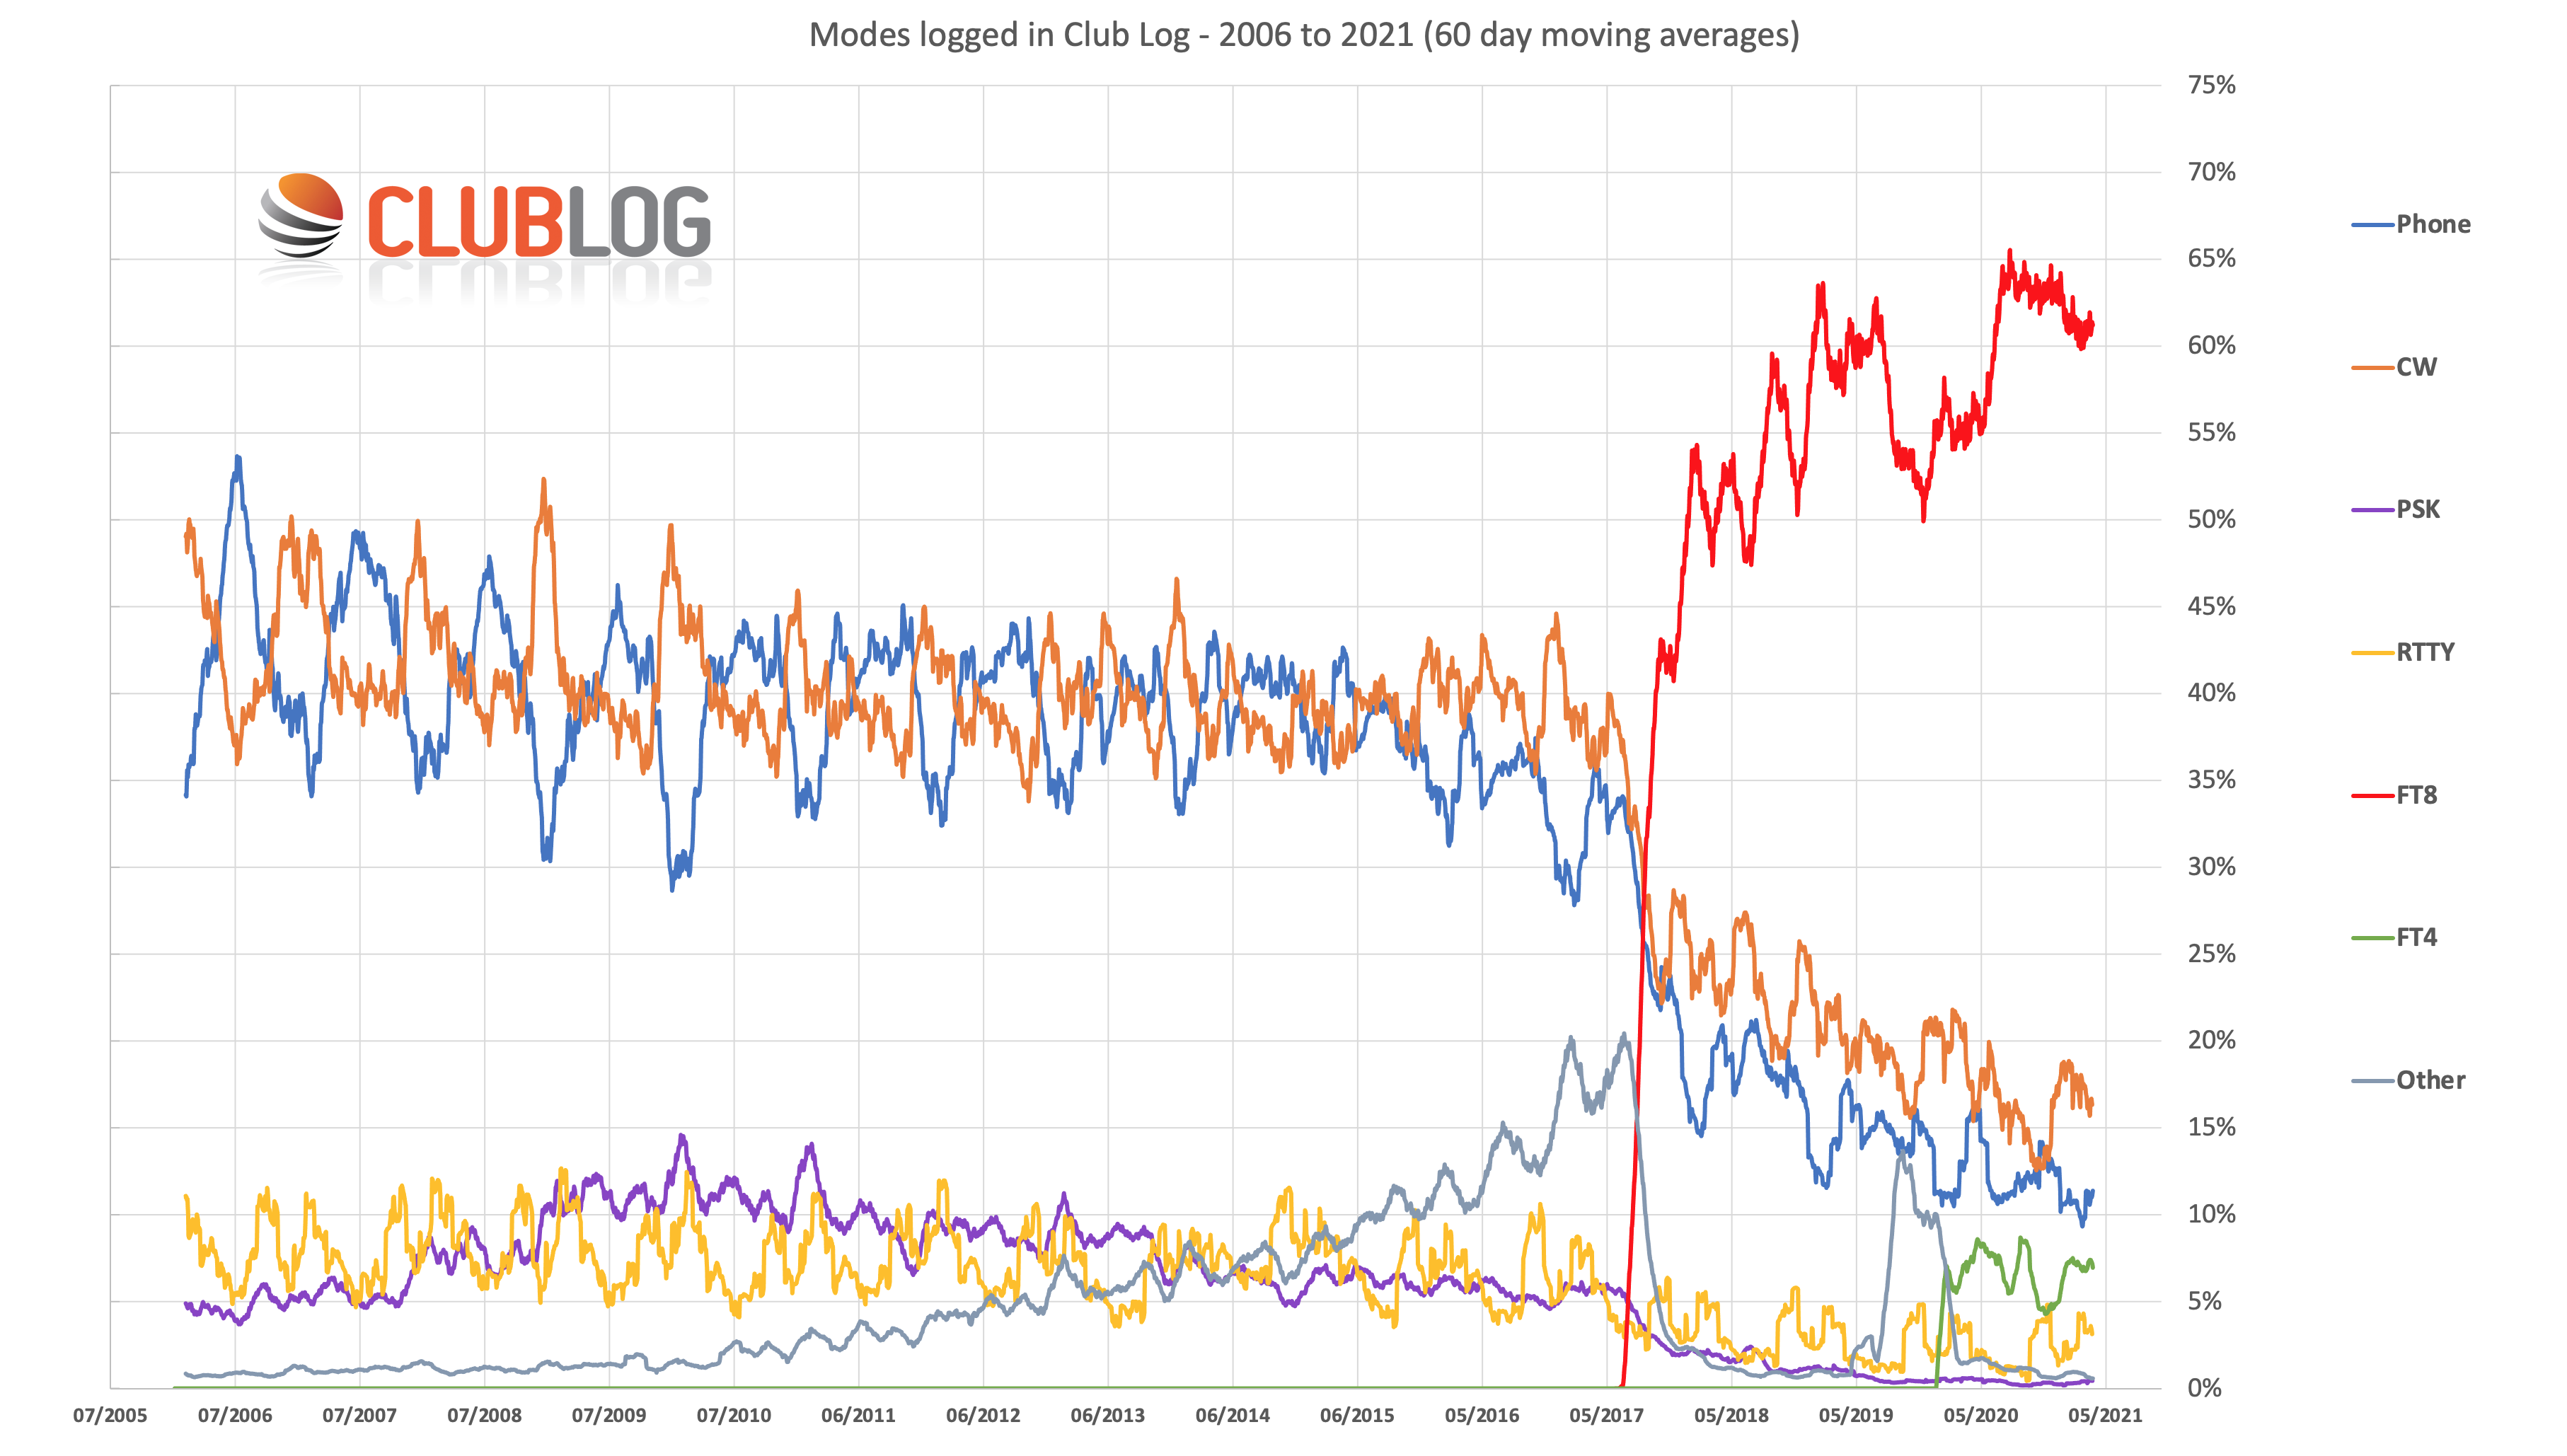
Modes logged – 2006 to spring 2021
Club Log records from around 2005 onwards show distinct patterns of which modes have been favoured. Be aware that the data is plotted using a 60-day moving average, which offsets the time by approximately two months to the right. Also notice, there is a period around 2019 where the “Other” chart rises. This artefact is due to the introduction of FT4 at a time when logging software and/or Club Log would have recorded this new mode as a generic mode.
Graph source: https://g7vjr.org/wp-content/uploads/2021/03/clublog-2006-2021.png
Raw data source: https://clublog.org/modes.csv
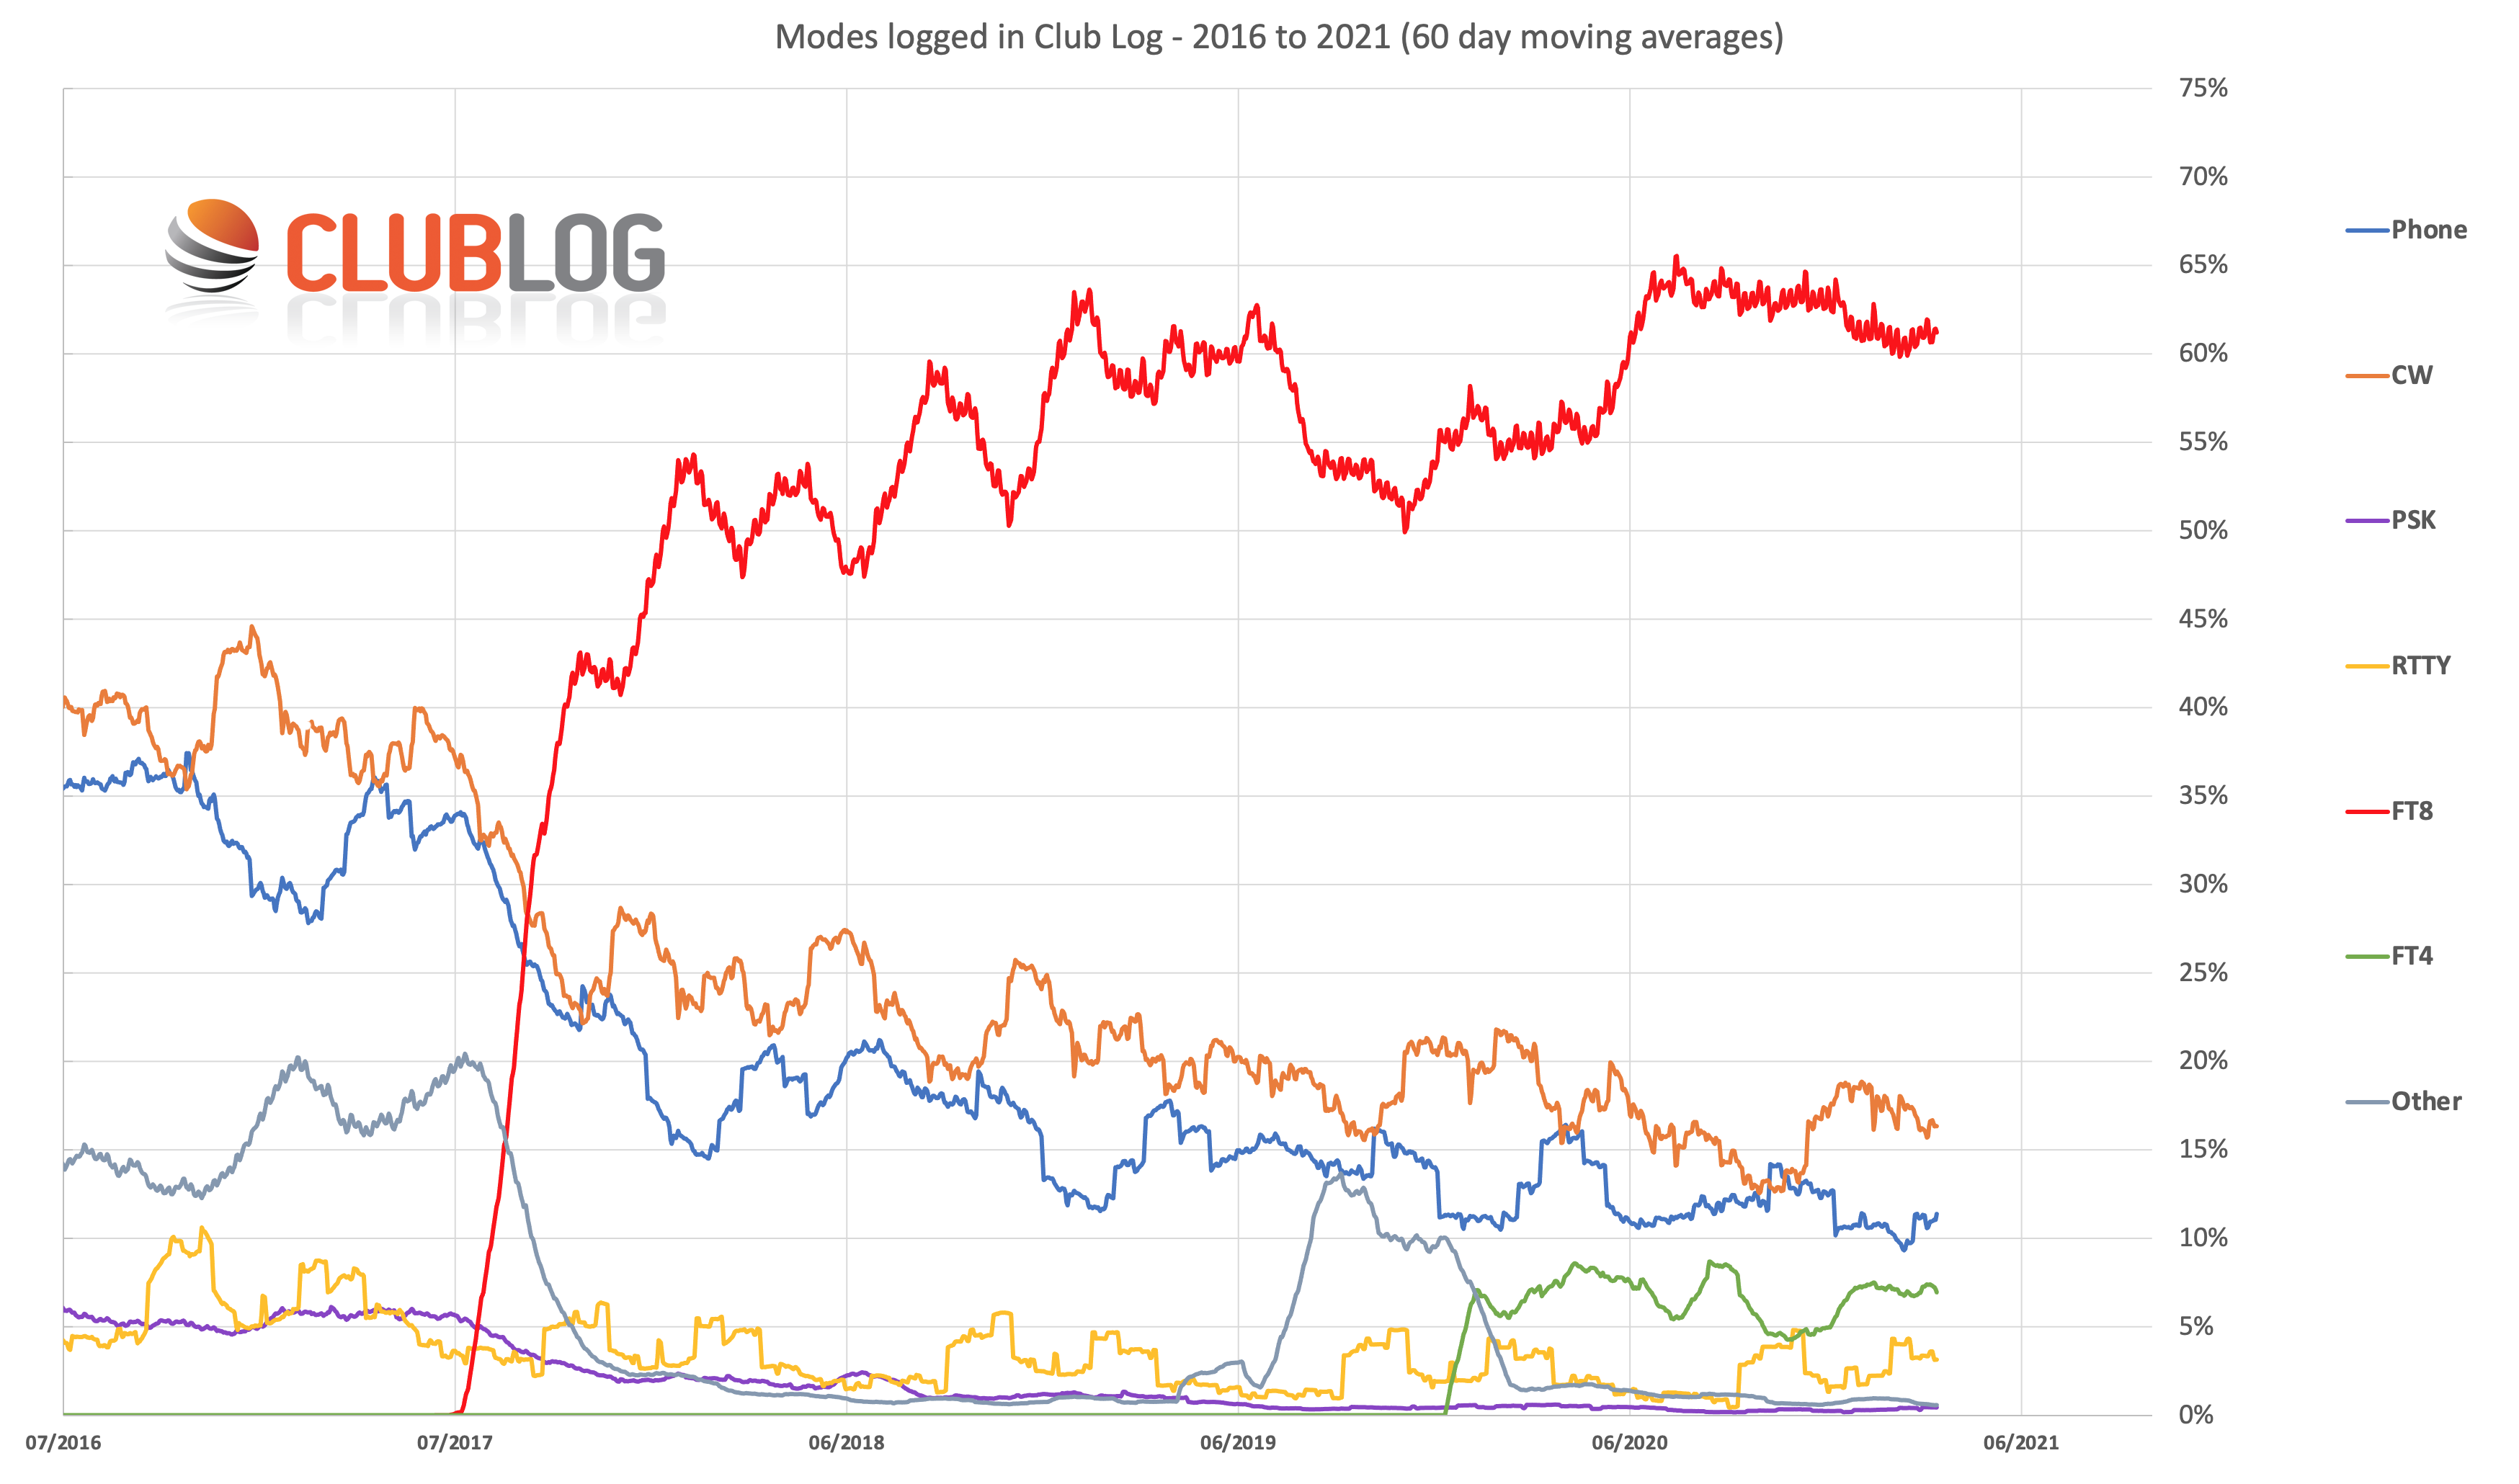
Modes logged – 2016 to spring 2021 (zoomed in)
Since the era of FT8 is of particular interest, here is a closer look at the period from just before FT8 to the present day. The data is plotted using a 60-day moving average again, and the FT4 ‘blip’ in the “Other” line is easily noticed. FT8 accounts for over 60% of activity, although on the 50MHz band the figure is nearly 85%.
Graph source: https://g7vjr.org/wp-content/uploads/2021/03/clublog-2016-2021.png
Raw data source: https://clublog.org/modes.csv
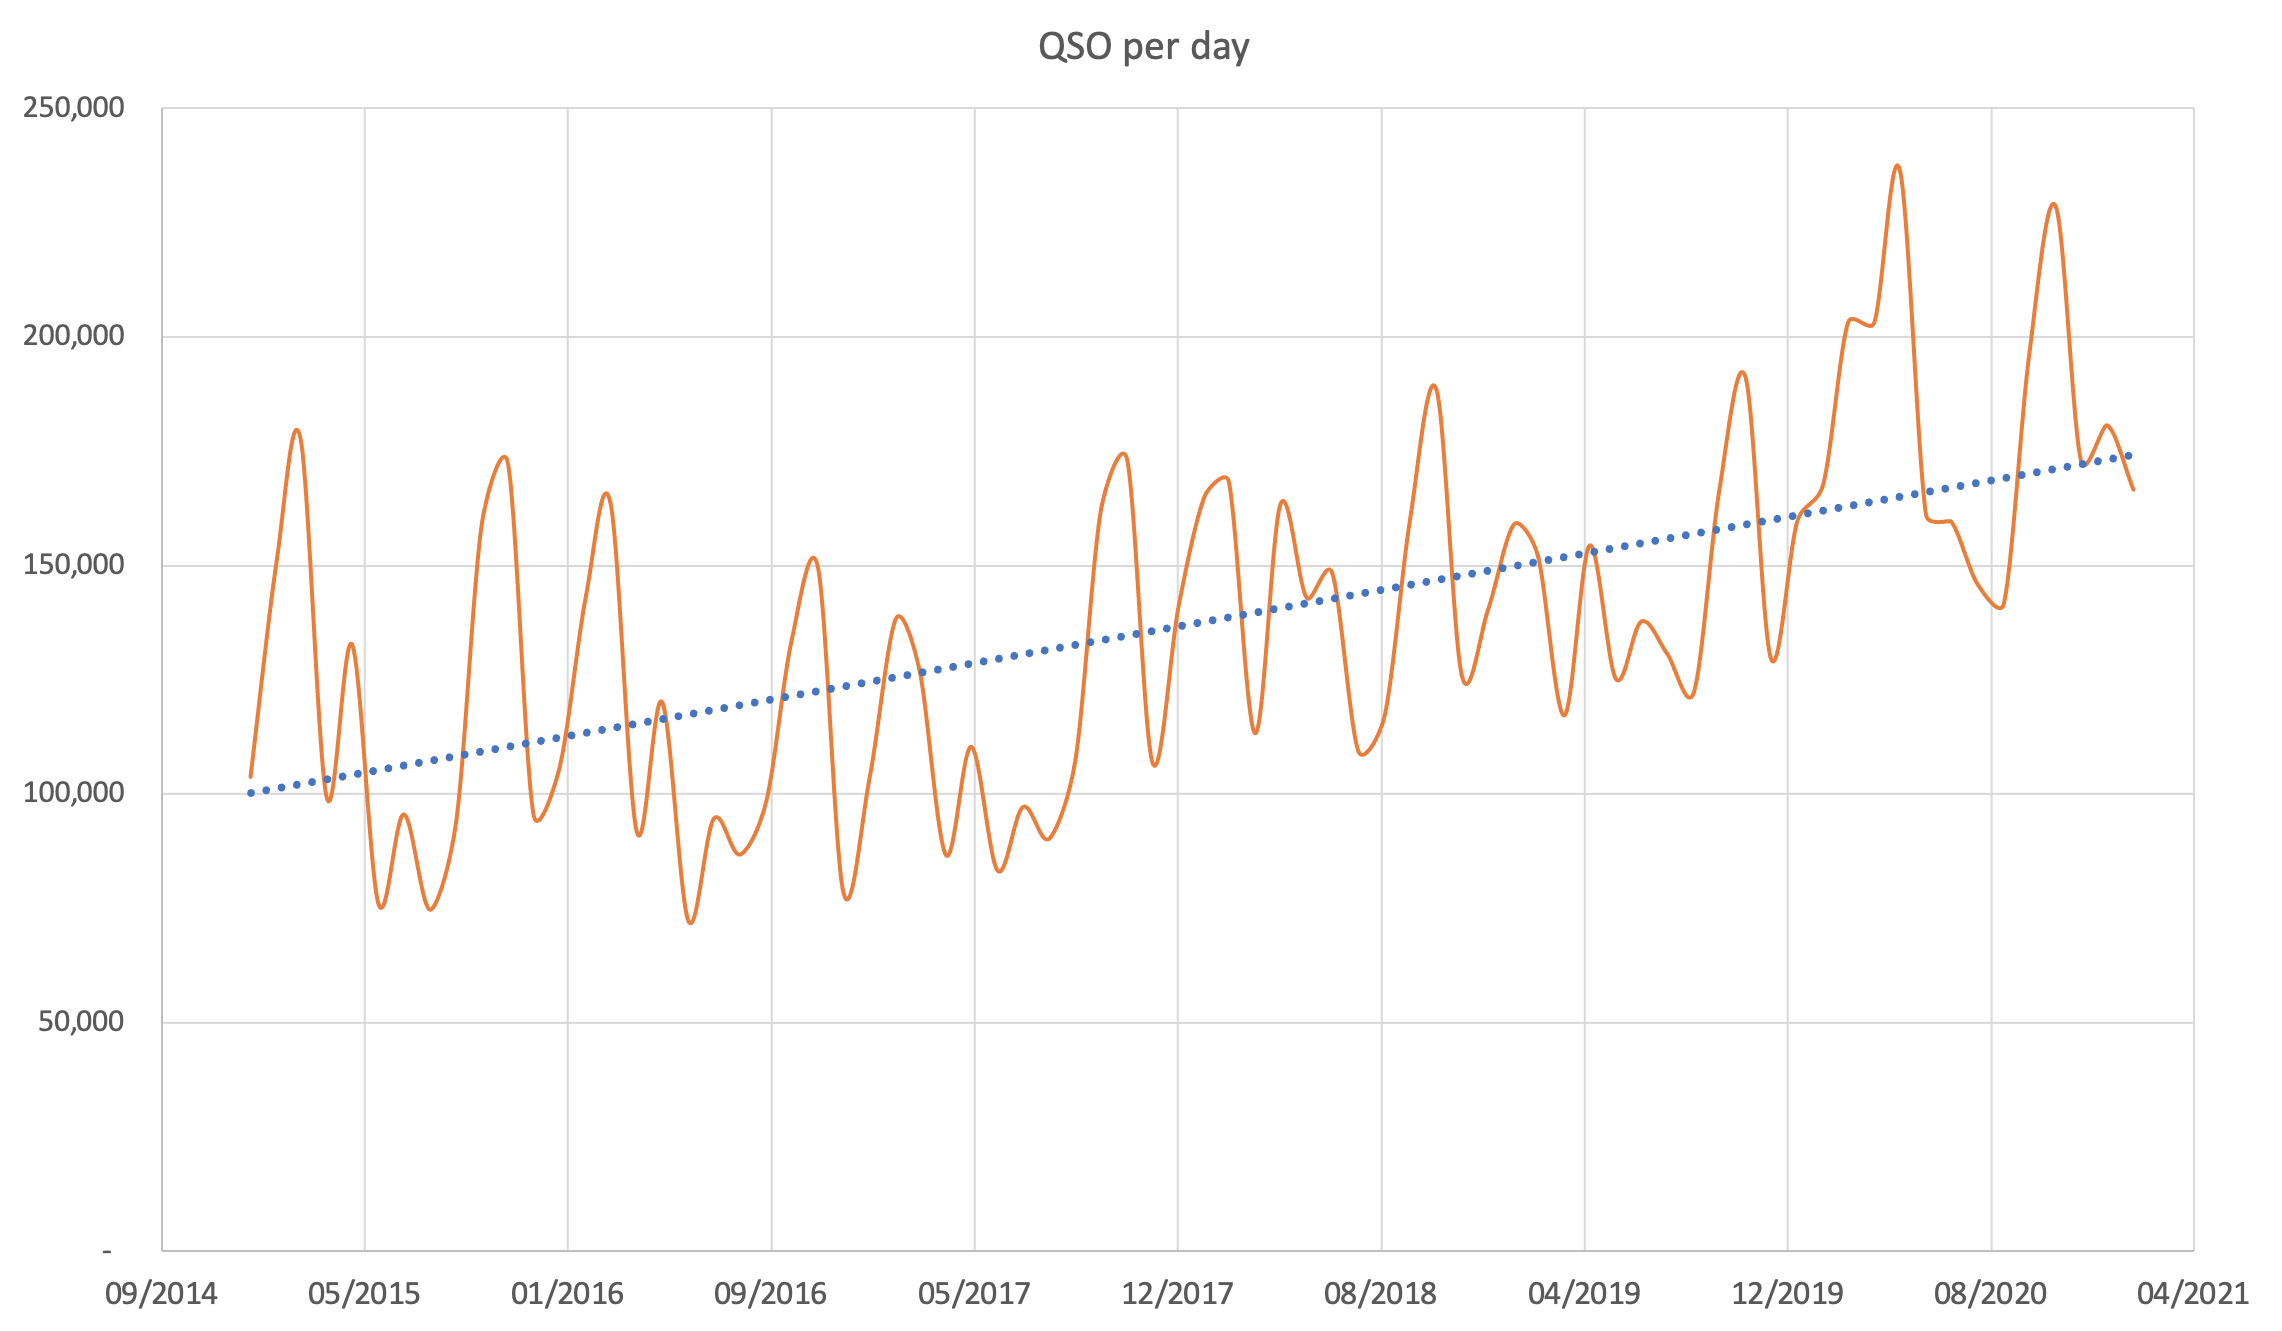
Average QSOs logged per day 2015-2020
This graph shows an upward trend in QSOs logged per day by Club Log users.
Graph source: https://g7vjr.org/wp-content/uploads/2021/03/clublog-qsos-per-day-1.png
Number of QSOs per active callsign per year, 2015 – 2020
Excluding inactive logs, the average number of QSOs uploaded to a callsign in Club Log between 27 March each year (12 months) has been increasing year-on-year.
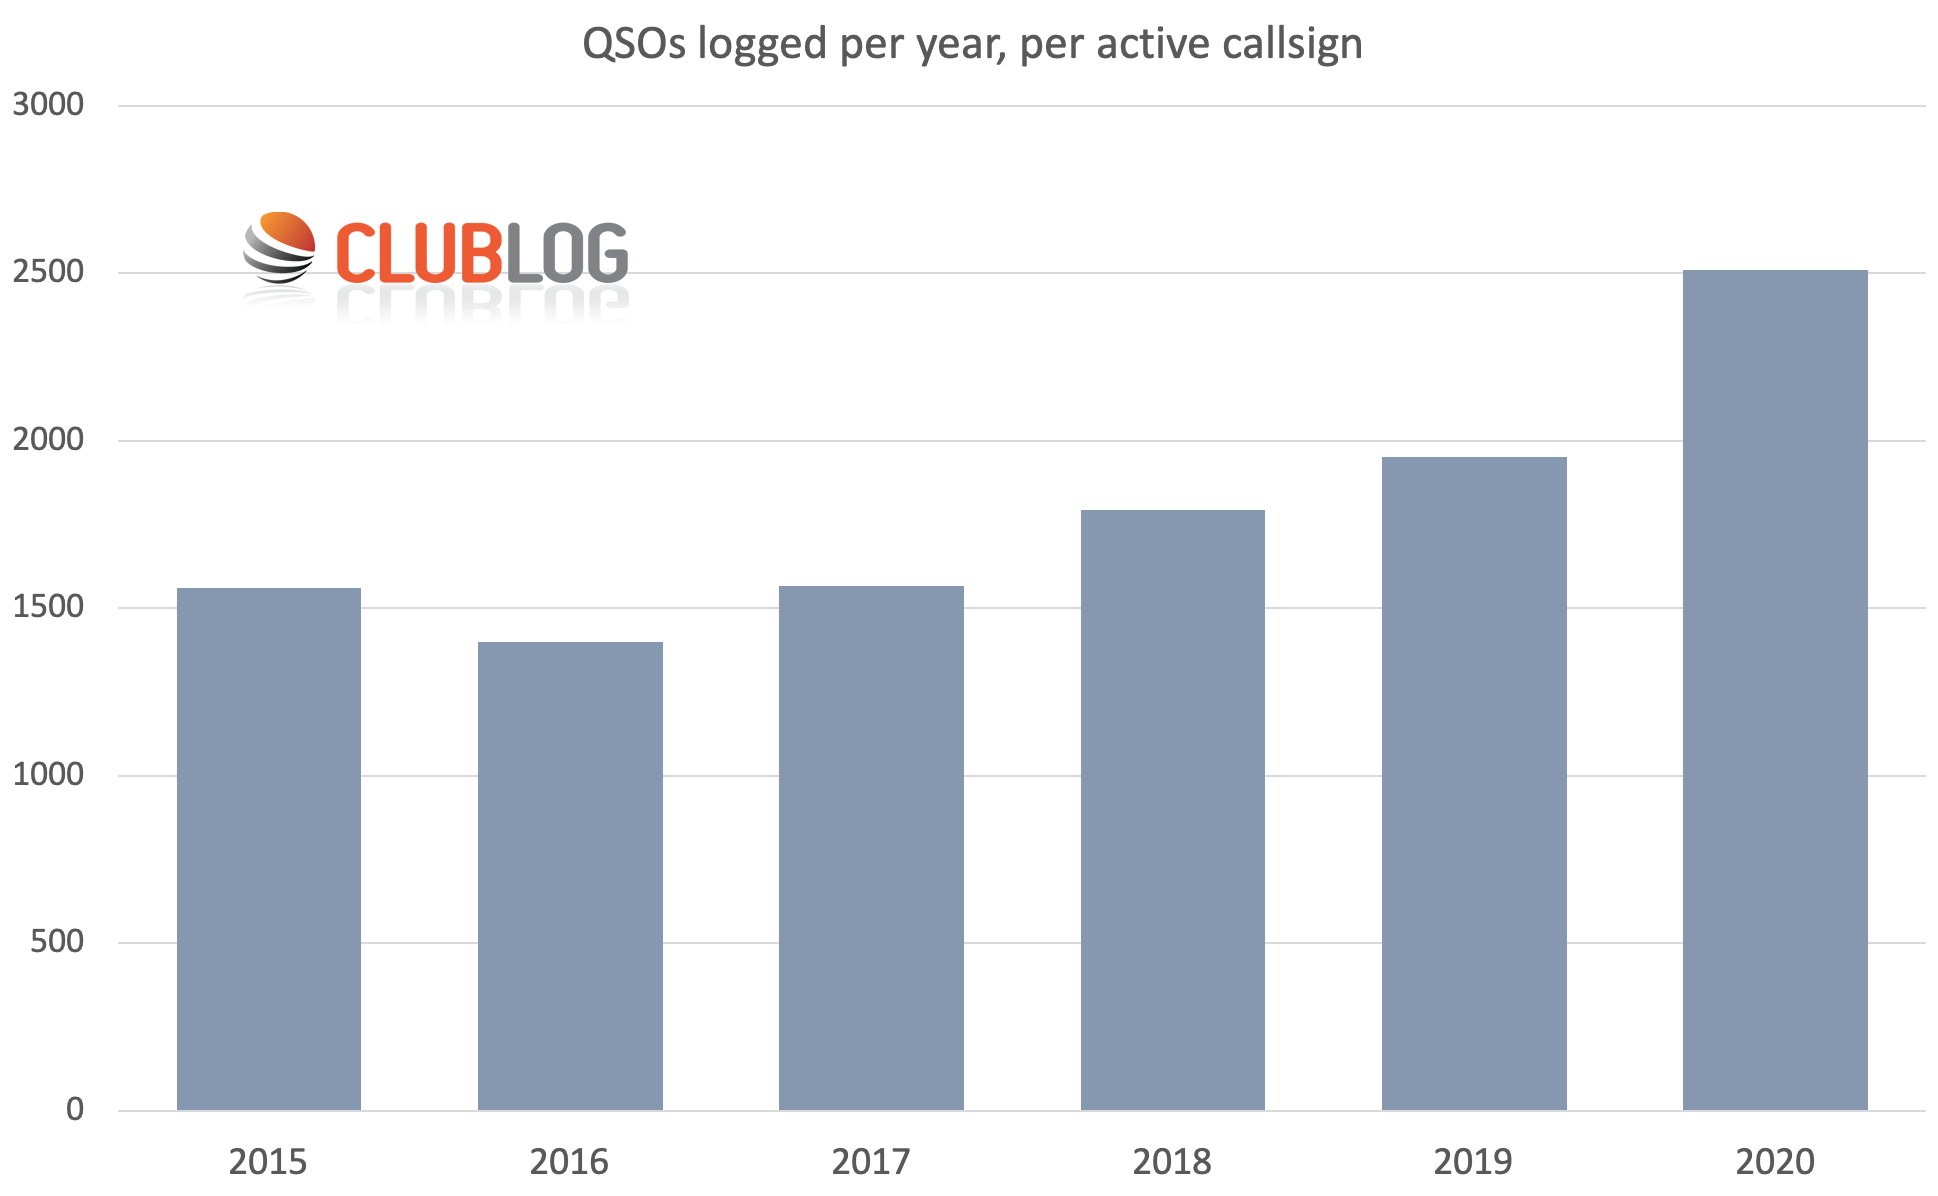
We can see there is an increase in QSOs logged of about 60% between the year 2015 and 2021, with the most dramatic increase being 2020-2021 (nearly 29% in one year). The earlier graph of the relative use of the modes provides the breakdown for these QSOs. There is a significant increase in data QSOs, accompanied by a smaller reduction in CW and Phone. For example:
- In 2015, the typical callsign logged 620 CW QSOs, 558 SSB QSOs and 372 data QSOs.
- In 2020, the typical callsign logged 500 CW QSOs, 300 SSB QSOs, and 1700 data QSOs.
Graph source: https://g7vjr.org/wp-content/uploads/2021/03/clublog-qsos-per-year.png
OQRS Requests Per Year
Club Log OQRS tools have processed $3,000,000 in OQRS transactions through PayPal for expeditions and other users. This graph shows the date of QSOs (not the date of the request being made in the OQRS tools). We can see there has been a decline in 2020, presumably due to the severely curtailed possibility of DXpeditions due to the pandemic. 2016 was a very busy year for major DXpeditions (see: https://clublog.org/allexpeditions.php and sort by date).

Graph source: https://g7vjr.org/wp-content/uploads/2021/03/clublog-oqrs-per-year.png
QSOs per band
As expected, propagation affects the relative use of the bands. Here is a graph showing the percentage of QSOs on each band over the last 20 years. The image for this is over 4000px wide (what you see below is just a “thumbnail” image).
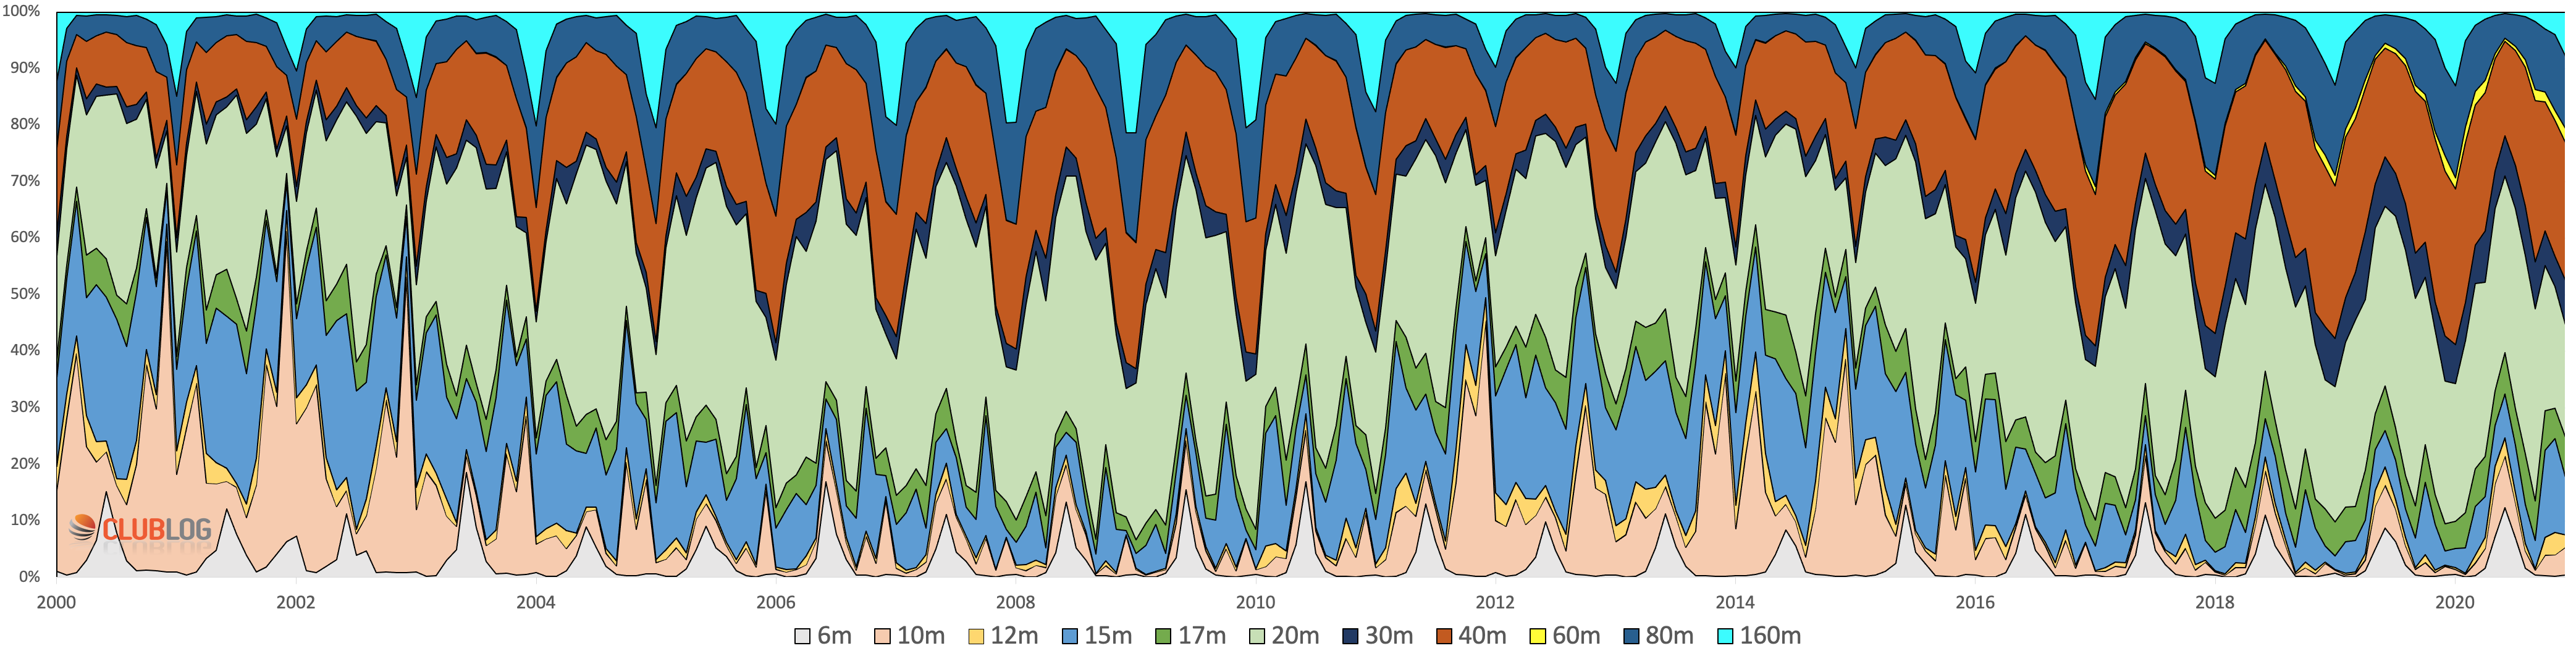
Even zoomed out, if you follow the central path in green (the 20m band) you can see the curve upwards around the peak of the last solar cycle, when 15m, 12m and 10m were much more active. The contest bands continue to dominate at all times in the cycle.
I’d suggest opening the full version to see it more closely! Just click the graph image.
Graph source: https://g7vjr.org/wp-content/uploads/2021/03/clublog-bands-year.png
Notes
You do not need to ask for permission to use anything on this page. The graphs may be used on any web site or publication (either linking to this page or downloading copies if you prefer). They are free of copyright or other encumbrances, provided they are used ‘as-is’ without removing the Club Log logos.
The key raw data used is also freely available and updated on an ongoing basis for use by anyone having an interest in exploring the data in more detail. The CSV file (https://clublog.org/modes.csv) is updated each month around the 10th day, but care should be taken with the last (most recent) month’s data as this may not yet contain all of the QSOs made, as Club Log users may only upload their new ADIF files periodically.
Tip: If you would like to watch trends in Club Log data, I generate a report at 14:00 UTC every day, which you can access here: https://clublog.org/dxreport.html. This is also emailed once a week to the Club Log reflector. It contains details of which modes have been used and which expeditions or rare callsigns have been logged.
Thanks one more time to the many Club Log users whose data made this report possible!
vy 73,
Michael G7VJR
27 March 2021