It’s been a while since I conducted an analysis of the modes on the air (such as in 2021). One of the reasons is that it’s quite laborious to do the analysis, and I haven’t really expected to be able to reveal something new that would garner attention. However, we are in the era of machine learning and I wanted to try something slightly different this year.
Using NeuralProphet, a time series AI modelling tool, I can feed in Club Log data about the way modes have been used up to approximately mid-summer 2023, and ask it to predict the activity – per mode – on any date in that window.
I used my Apple workstation to do the predictions. It took a few hours to build all the models. I considered asking for long range predictions, and in principle that is no different, but I think we have learned to expect disruption (such as from new modes) so I decided two years was plenty.
Here are two graphs containing projections for the next two years. I used a 7 day smoothing window to ensure that weekends would not create choppy trend lines.
Firstly, as a percentage of band activity (adding FT4 and FT8 together for simplicity):
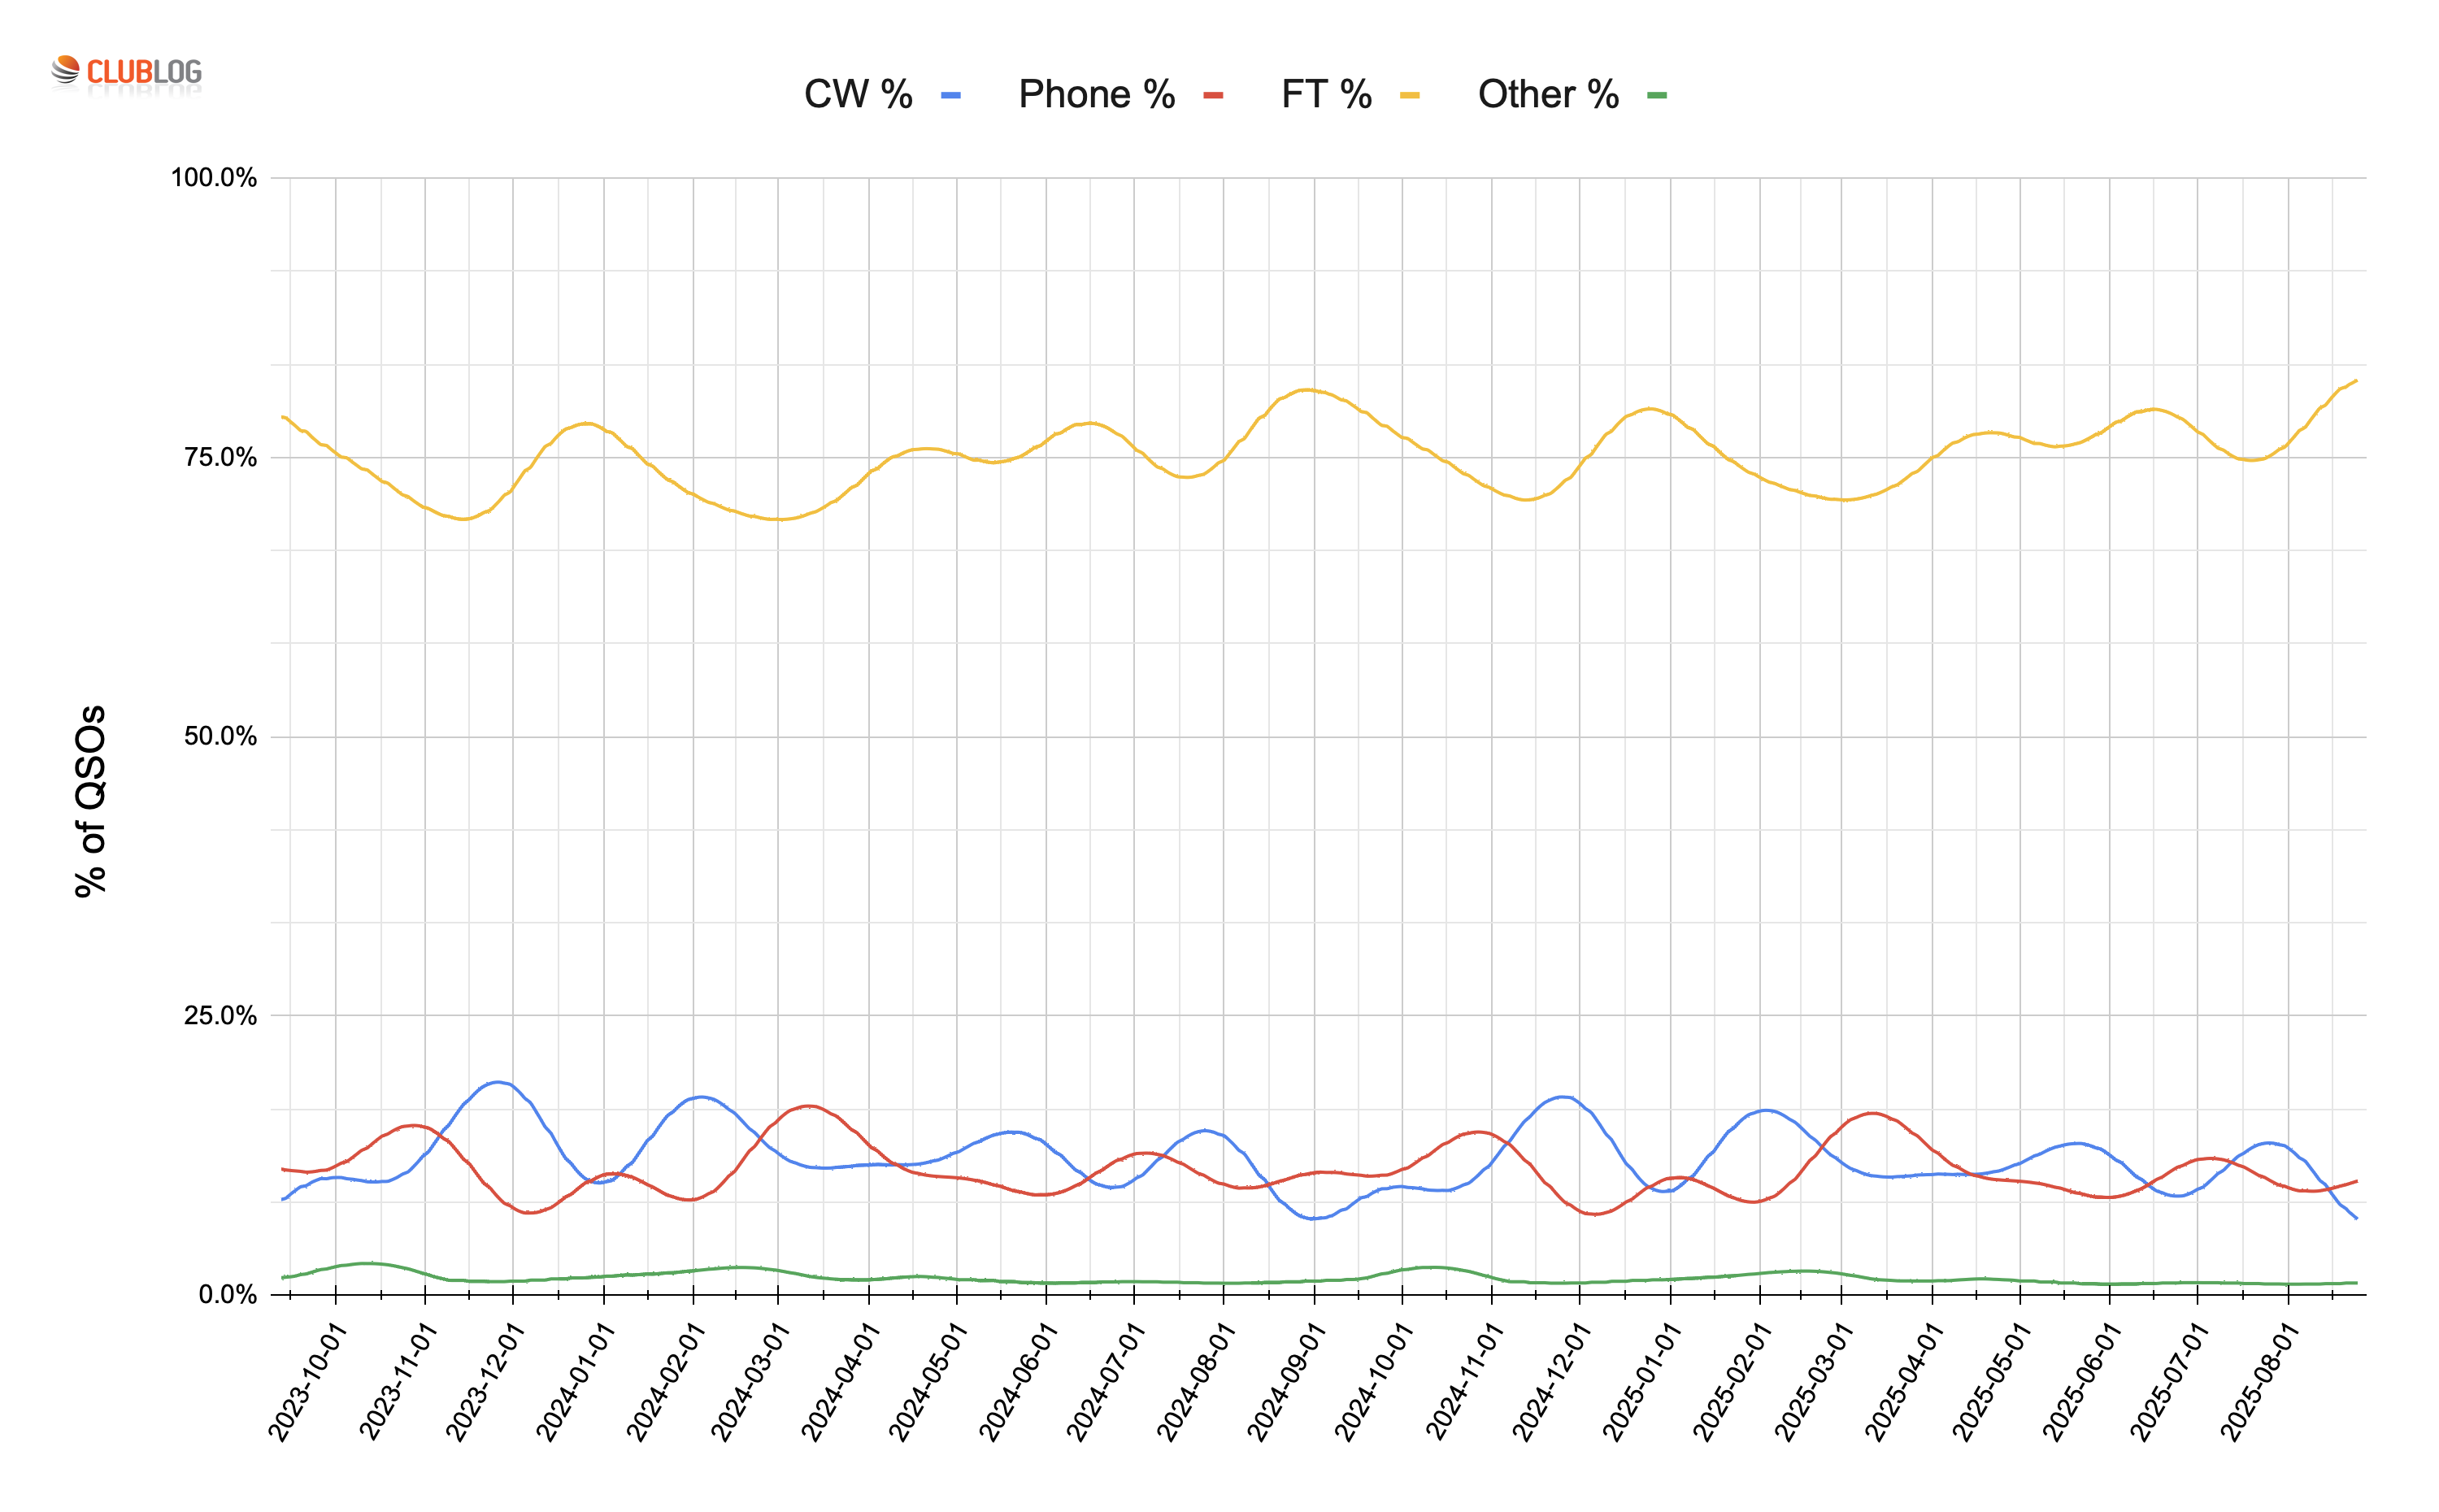
The expected use of FT8 is about the same as today, i.e. about three-quarters of all QSOs are on FT4 and FT8. There is a slight decline in CW and Phone activity predicted. Don’t forget, if you don’t like the thought of that, call CQ on your preferred modes!
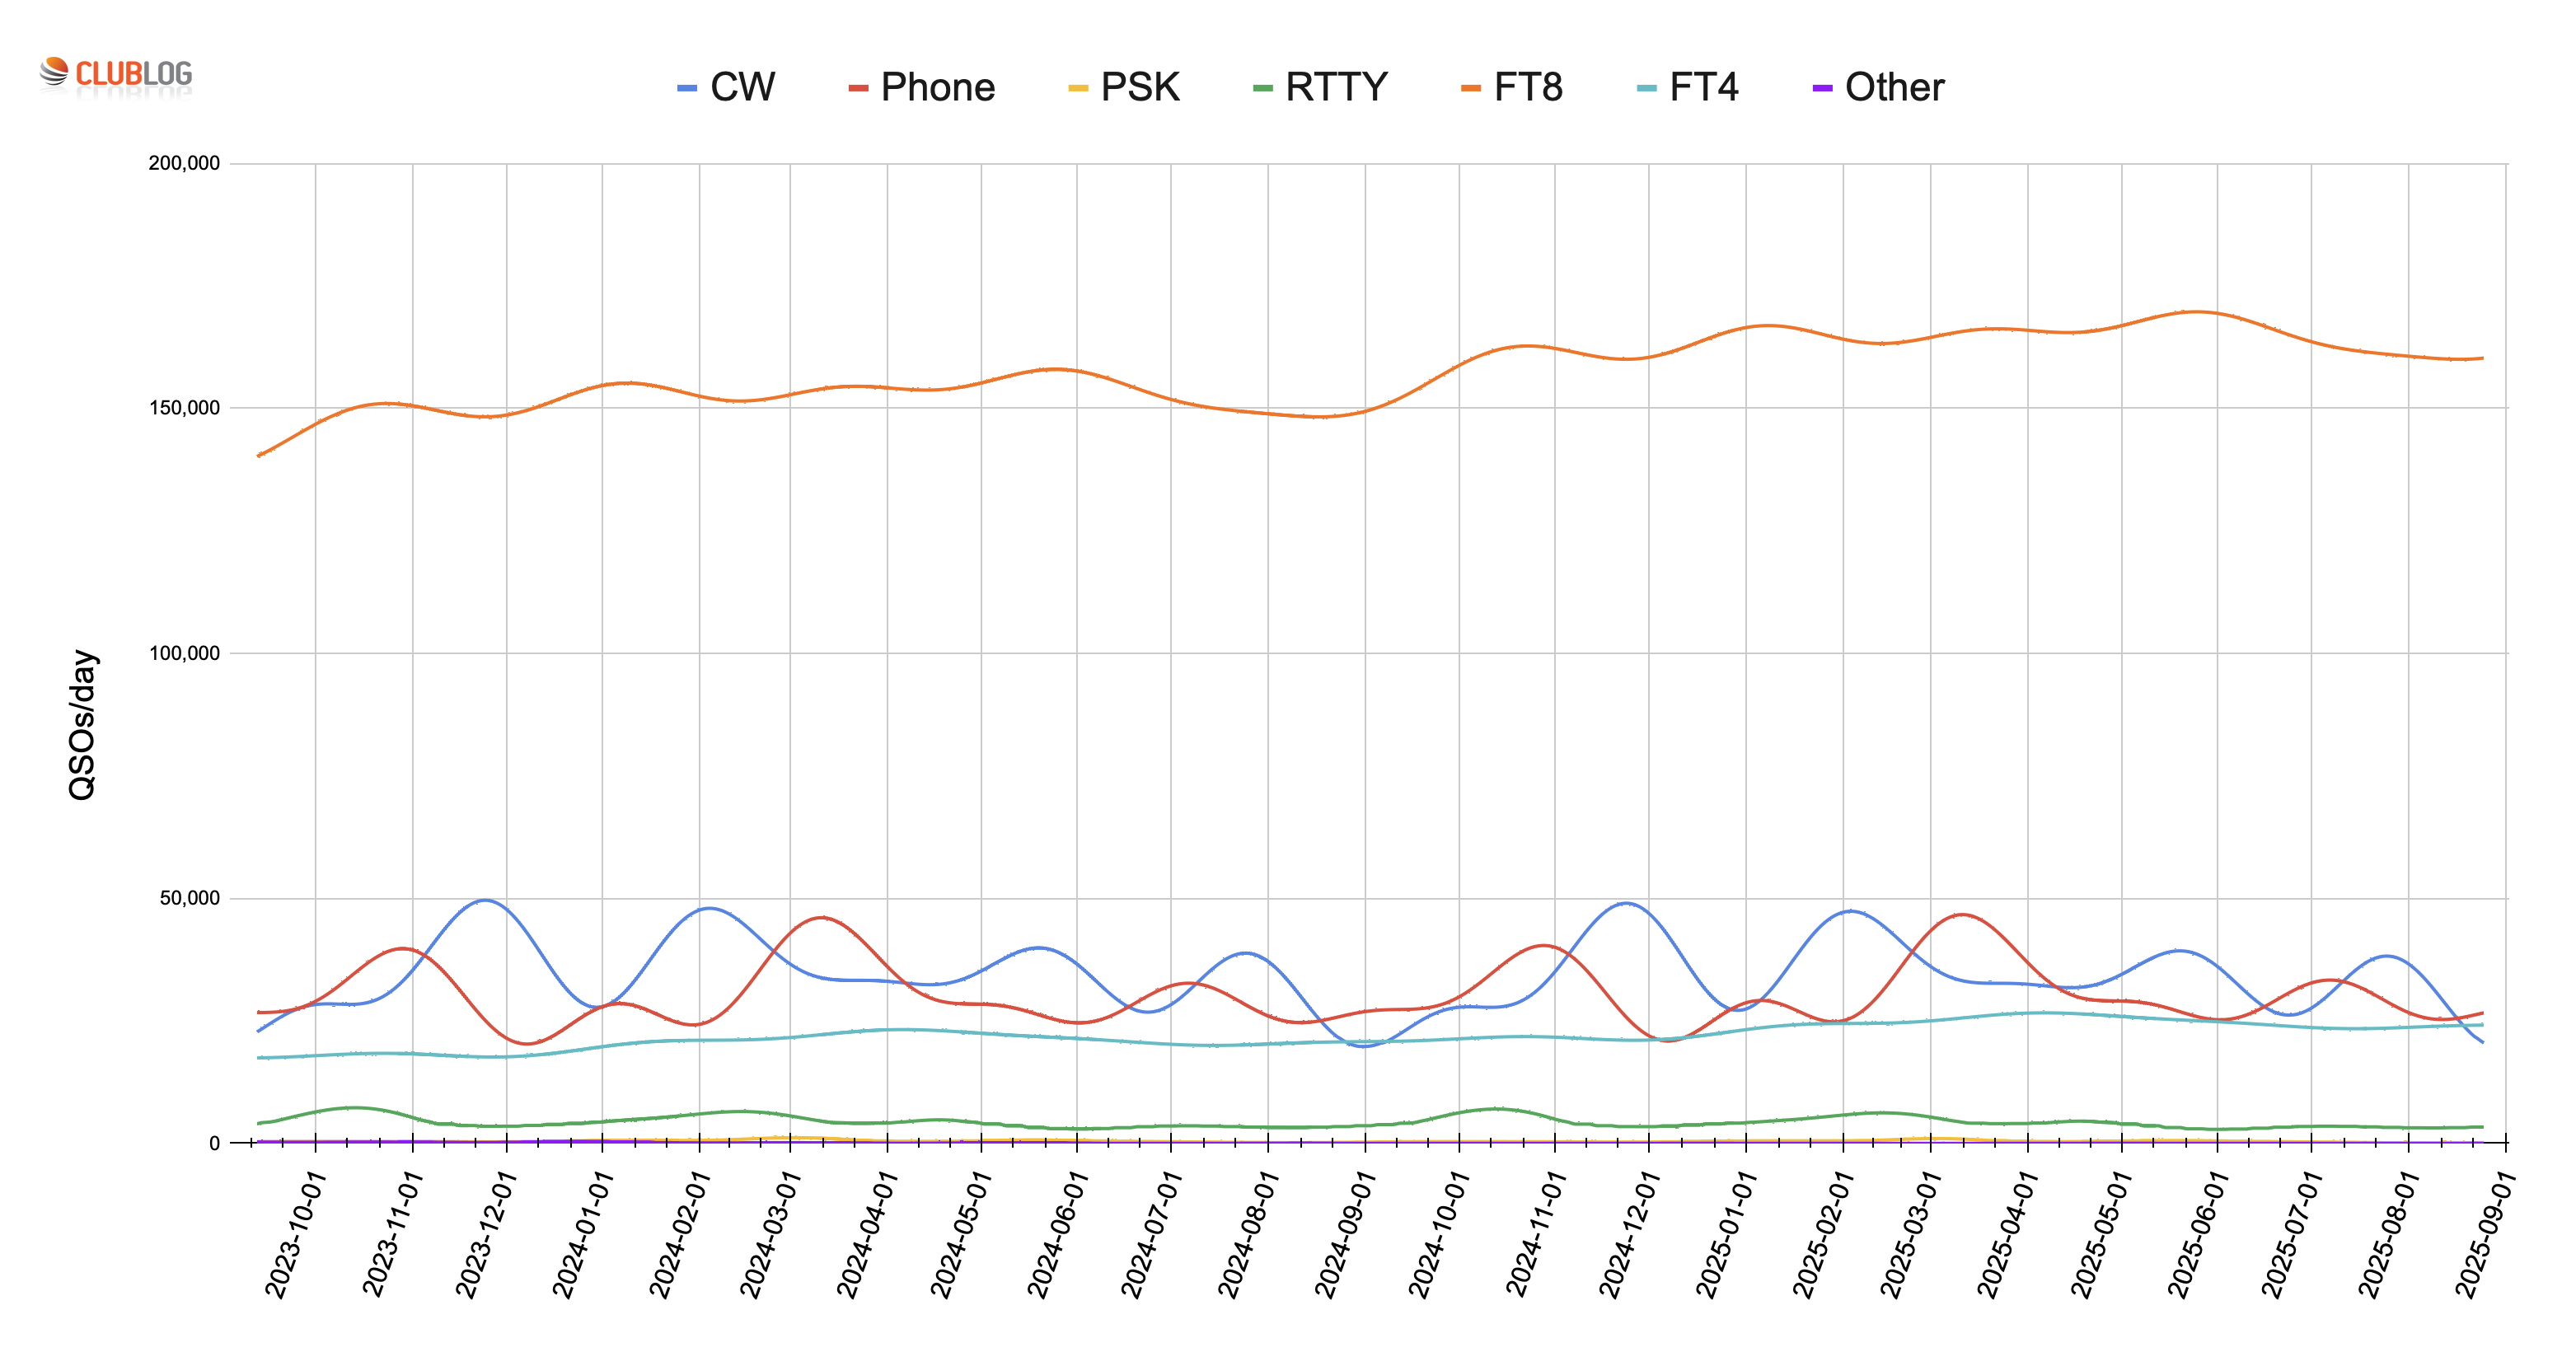
Secondly, here’s the data but now as absolutes in terms of QSO numbers per day and separating out extra modes:
Notes
Purists will ask why I am using AI to do statistics. Well, this is partly academic, and partly because AI made this easier for me. The allure and power of the AI models is their deep learning capability. For example, NeuralProphet can tell that weekends are busier, or that contests fall on certain dates (and favour certain modes). It also sees the patterns of solar flux affecting the bands’ utilisation (which impressed me quite a bit). Making multi-variable models to do time series predictions would be possible, but the AI approach made it just a few lines of Python code for me, which I definitely feel is progress.
The key raw data used is also freely available and updated on an ongoing basis for use by anyone having an interest in exploring the data in more detail. The CSV file (https://clublog.org/modes.csv) is updated each month around the 10th day, but care should be taken with the last (most recent) month’s data as this may not yet contain all of the QSOs made, as Club Log users may only upload their new ADIF files periodically.
Tip: If you would like to watch trends in Club Log data, I generate a report at 14:00 UTC every day, which you can access here: https://clublog.org/dxreport.html. It contains details of which modes have been used and which expeditions or rare callsigns have been logged.
73,
Michael G7VJR
You do not need to ask for permission to use anything on this page. The graphs may be used on any web site or publication (either linking to this page or downloading copies if you prefer). They are free of copyright or other encumbrances, provided they are used ‘as-is’ without removing the Club Log logos.